


 198 320

(1) intra-AR structural variation is prevalent and calls into
question the ubiquitous assumption that noncanonical AR
transcripts arise merely as a consequence of alternative
splicing; (2) the majority of splice variant–positive patients
express multiple variants, with AR-V3 being most abun-
dantly expressed; and (3) comprehensive AR profiling will
be necessary to increase our understanding of the molecular
mechanisms underpinning resistance to endocrine treat-
ment.
To investigate the presence of intra-AR structural
variation, we performed targeted sequencing of the entire
AR
gene, including nonrepetitive intronic regions. Structural
variation was detected in 15/30 profiled patients, and the
clustering of focal events towards the 3
0
region of the AR
was striking
( Fig. 3 ). In turn, 14/15 patients harbouring
intra-AR structural variation also expressed splice variants.
The only intra-AR structural variation–positive patient who
was splice variant–negative rapidly progressed on abir-
aterone treatment. Although we cannot demonstrate a
causal relationship between intra-AR structural variation
and the expression of noncanonical AR transcripts, previous
pioneering work on disease models has demonstrated an
association between intra-AR genomic variation and the
generation of truncated AR transcripts
[24,25,28] .The majority of cfDNA samples with intra-AR variation
harboured multiple structural AR variants (11/17). Events
were detected that are highly likely to generate a
nonfunctional AR version. Under the evolutionary pressure
of endocrine treatment, diverse somatic AR versions will
emerge. In the context of AR amplifications, multiple AR
versions may exist within the same cell, with nonfunctional
versions existing in parallel with truncated and full-length
AR copies. Interestingly, multiple structural variants were
also detected in 4120-P-2015352, harbouring no amplifica-
tion
( Fig. 3 ). Therefore, we suggest a model in which
multiple AR versions may emerge either within the same
clone or between different clones as a consequence of
endocrine treatment (Supplementary Fig. 10).
Structural variation was not detected in all ARV-positive
liquid biopsies. It has been shown that in the context of AR
amplification, increased elongation rates leads to genera-
tion of splice variants, which suggests a connection to
processes other than intra-AR structural variation
[19] .However, as this was a retrospective study, we
generated DNA sequencing libraries from available plasma
aliquots of 1.25 ml. Low DNA input would potentially
limit the power to detect structural variation, especially as
baits applied for enrichment are biased towards the
reference genome (Supplementary Fig. 11). Indeed, to
achieve 95% sensitivity for detection of all variants,
including subclonal events,
>
10 000 coverage would be
needed (Supplementary Fig. 12). As expected, there was
clear coverage bias, whereby samples with detectable intra-
AR variation had higher coverage than negative samples
(Supplementary Fig. 13). Therefore, it is almost certain that
undetected intra-AR variation was due to sequence cover-
age. In addition, as repetitive regions exist in the AR, which
are not possible to enrich and sequence, variants may be
missed if (1) both ends of the structural variant reside
within repetitive regions or (2) one end lies within
repetitive DNA and the other is outside the AR. Of note,
all intra-AR structural variants detected here were classified
as somatic, except the 3.7-kb intron 1 deletion detected in
3883-P-2013569, which was present in germline DNA. At
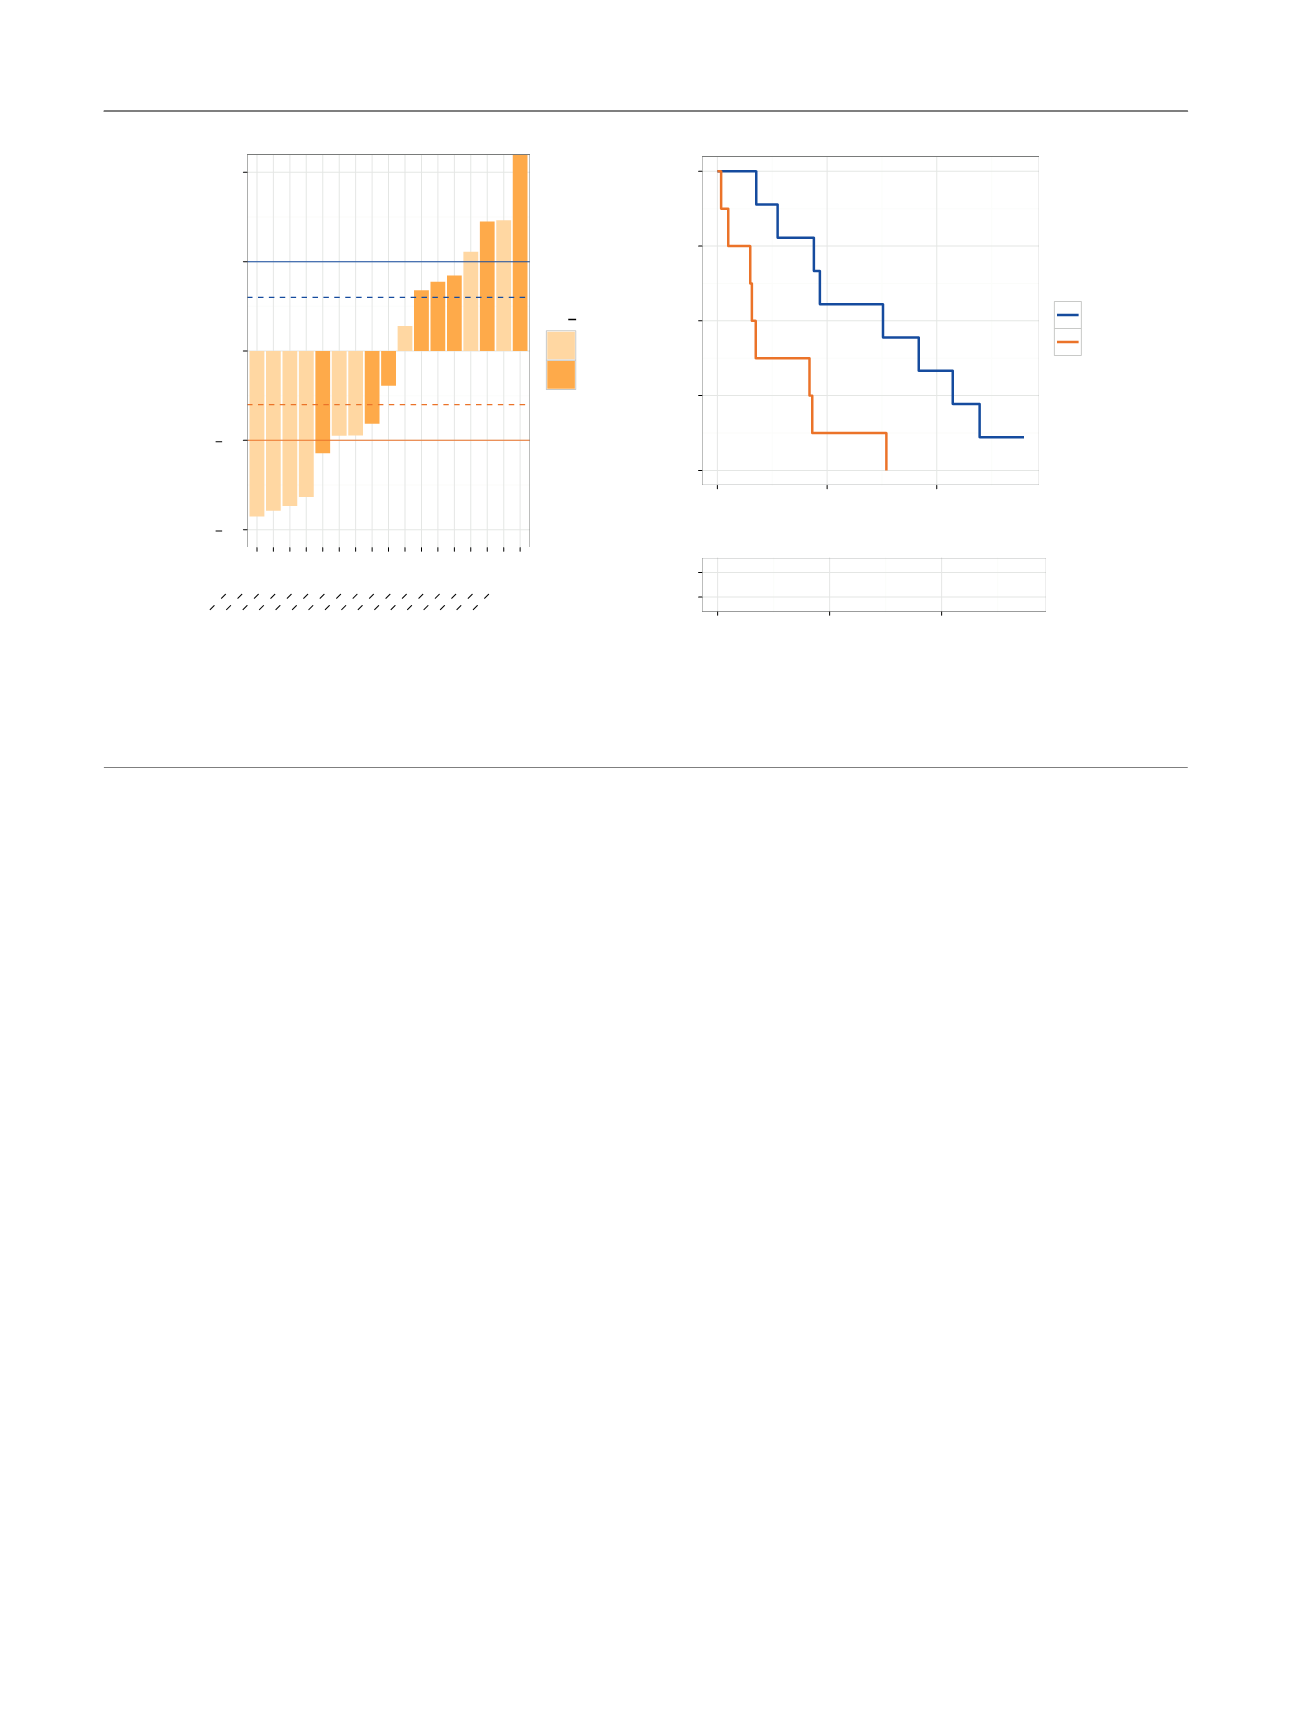
[(Fig._5)TD$FIG]
1.0
0.5
0.0
0.5
1.0
A)
B)
3949 P 2014061
4037 P 2014250
4177 P 2015054
4173 P 2014436
4080 P 2014422
4081 P 2014482
3945 P 2014041
3542 P 2013565
3886 P 2013651
4070 P 2014161
3943 P 2014017
4174 P 2014501
4068 P 2014232
4072 P 2014101
3947 P 2014057
3950 P 2014087
3885 P 2013618
PSA fold change (10–12wk)
AR V
Neg
Pos
+
p
= 0.0057
0.00
0.25
0.50
0.75
1.00
0
200
400
Time to NLCB (d)
Progression–free survival
ARV
+
+
Neg
Pos
9
5
3
8
1
0
Pos
Neg
0
200
400
Time to NLCB (d)
ARV
Number at risk by time
*
Fig. 5 – Androgen receptor splice variants (ARVs), prostate-specific antigen (PSA) response, and progression-free survival on hormonal therapy. (A)
Waterfall plots of PSA responses after 10–12 wk on therapy. Dashed and full lines represent 30% and 50% increases and decreases. * PSA increase of
528%. (B) Kaplan-Meier analysis of progression-free survival, measured as time to no longer of clinical benefit (NLCB) stratified according to ARV
presence in circulating tumour cells at baseline. The log-rank test was used to calculate the
p
value.
E U R O P E A N U R O L O G Y 7 2 ( 2 0 1 7 ) 1 9 2 – 2 0 0
198