


 197 320

discontinued treatment and was left out of the analysis. At
10–12 weeks, a PSA response rate of 30% and 50% was
achieved in 8/17 (47%) and 5/17 (29.4%) patients, respec-
tively. The PSA response rates at 10–12 wk were not
significantly different between patients with (
n
= 8) and
without (
n
= 9) any ARV detected (Fisher’s exact test,
p
= 0.15 and 0.29, respectively;
Fig. 5A). The median
follow-up time for progression-free survival was 5.7 mo
(range 0.25–18.3). At the time of analysis, one patient was
still receiving abiraterone. ARV presence was associated
with progression-free survival, measured as the time to no
longer of clinical benefit (hazard ratio 4.53, 95% confidence
interval 1.424–14.41;
p
= 0.0105;
Fig. 5 B).
4.
Discussion
We performed comprehensive AR profiling in liquid
biopsies obtained from 30 CRPC patients. Our simultaneous
analysis of CNVs, point mutations, intra-AR structural
variation, and splice variants revealed three key findings:
[(Fig._4)TD$FIG]
Sample_type
Therapy
5
25
200
1000
CTC
CNV
CNV
5'−UTR
Ex 1
In 1
Ex 2
In 2
CE−region
LBD−region
3'−UTR
Intra−AR
Ser889Asn
His875Tyr
Val716Met
Leu702His
AR−LBD MUT
AR45
ARV1
ARV2
ARV3
ARV5
ARV7
ARV9
AR−V
4068−P−2014232
3885−P−2013618
3542−P−2013565
3947−P−2014057
3886−P−2013651
4042−P−2014339
3943−P−2014017
3950−P−2014087
4174−P−2014501
4173−P−2014436
4072−P−2014101
4080−P−2014422
4070−P−2014161
4037−P−2014250
3945−P−2014041
3949−P−2014061
4081−P−2014482
4177−P−2015054
0
200
400
600
AR−V (transcripts/1000 reads)
3885−P−2014159
4120−P−2015352
3843−P−2013537
3542−P−2014235
4253−P−2015247
4045−P−2014404
3883−P−2013569
4174−P−2015066
4175−P−2014393
4069−P−2014174
3884−P−2015187
4070−P−2014414
AR Splice variant
AR45
ARV1
ARV2
ARV3
ARV5
ARV7
ARV9
baseline
progression
CNV status
0
1
2
Intra−AR rearrangement
COMPLEX
DELETION
TANDEM_DUPLICATION
WT
INVERSION
Mutational status
MT
WT
ARVSEQ_MUT_VALIDATION
ARV status
Neg
Pos
n
abi
enza
2
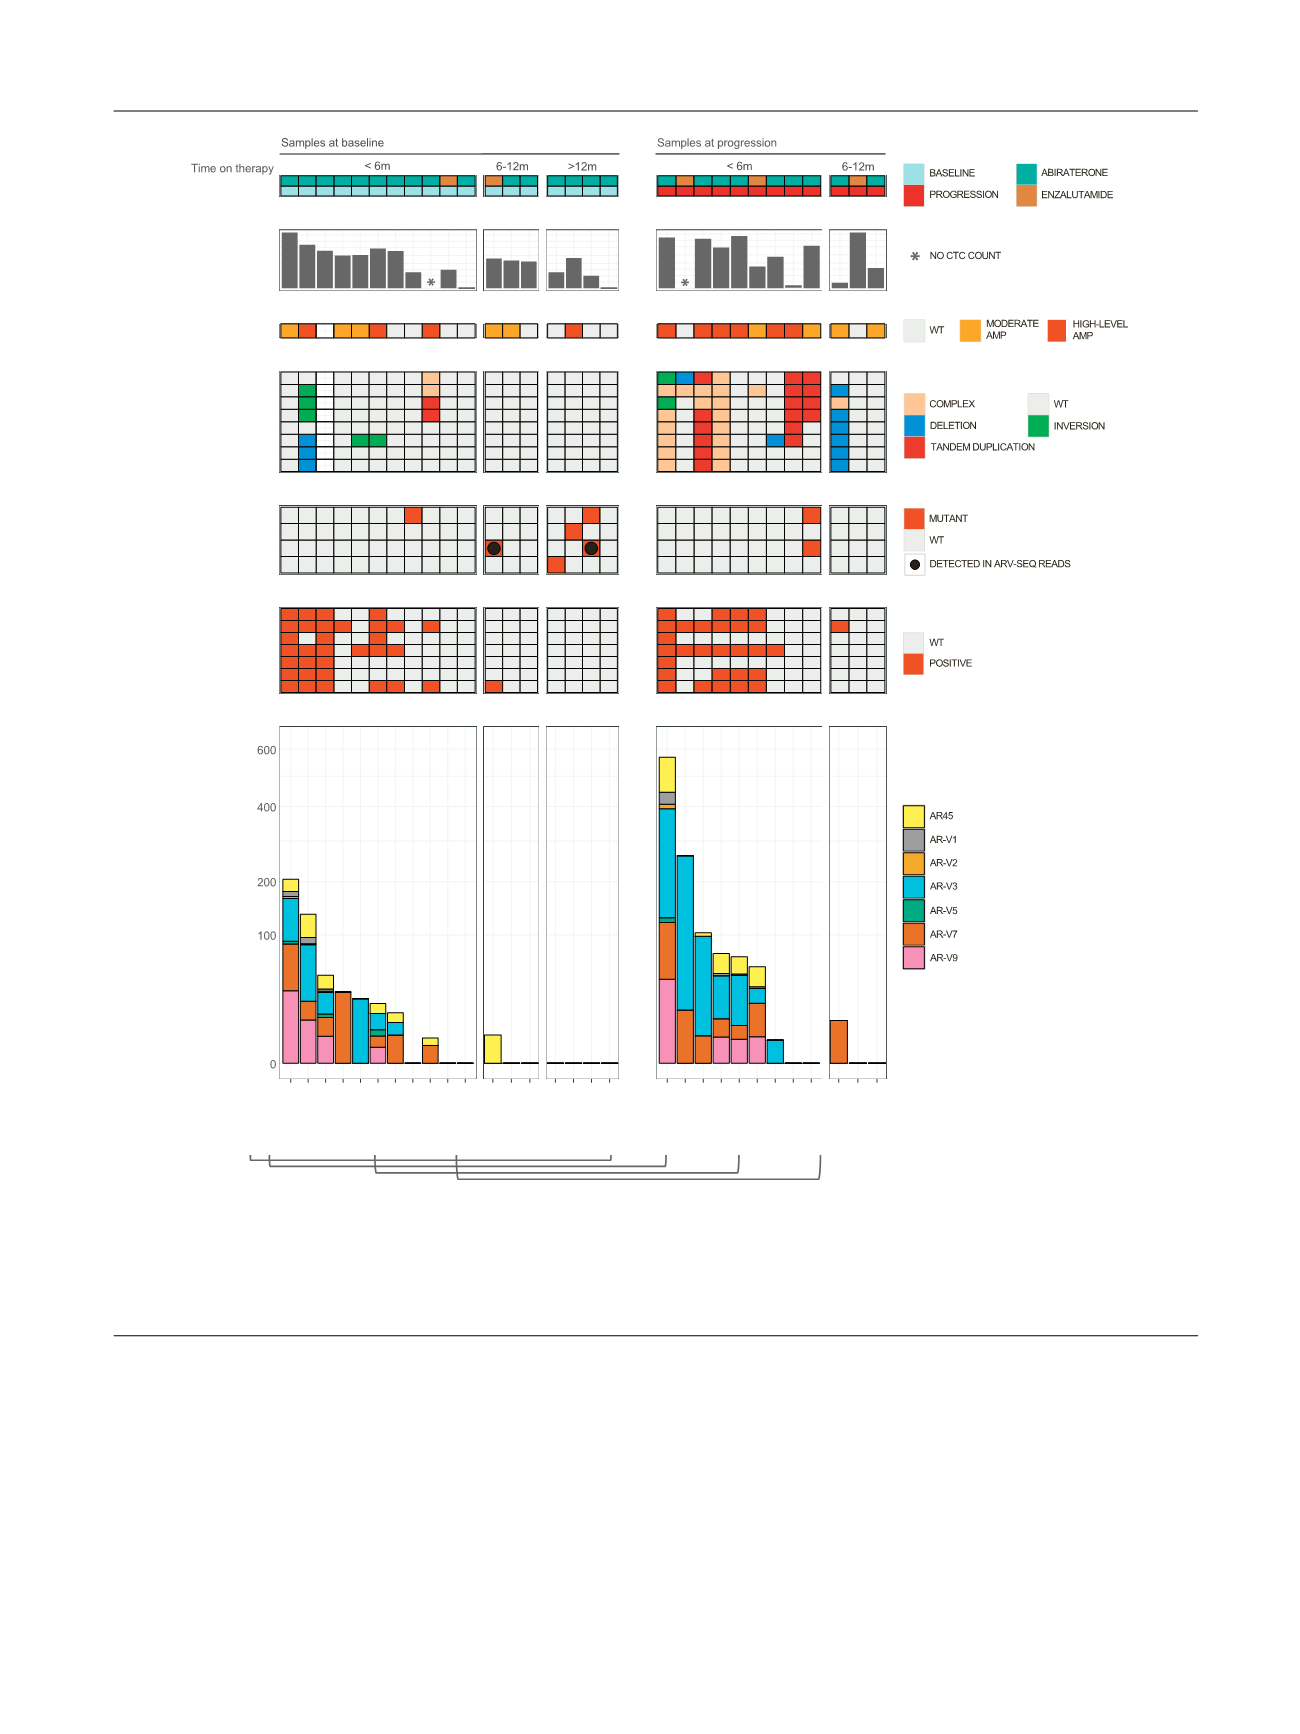
Fig. 4 – Multi-level AR profiling in patients with castration-resistant prostate cancer (
n
= 26) at baseline or at progression on abiraterone or
enzalutamide. Samples are grouped according to time on therapy. CTC panel: number of CTCs expressed per 7.5 ml of blood. * Aborted samples during
CellSearch. CNV panel: AR copy number stratified according to amplification status. Intra-AR panel: structural variants across the AR gene. Complex
rearrangements denote multiple overlapping variant types within the particular region. AR-LBD MUT panel: hotspot mutations within the ligand-
binding domain of AR. Black dots denote hotspot variants detected in full length AR transcripts during RNA sequencing. Bottom two AR-V panels
provide a qualitative and quantitative overview of ARV expression. Brackets denote samples from the same patient.
E U R O P E A N U R O L O G Y 7 2 ( 2 0 1 7 ) 1 9 2 – 2 0 0
197