


 195 320

[(Fig._2)TD$FIG]
A)
B)
C)
D)
300 bp
600 bp
500 bp
300 bp
212 kb
254 kb
34 mb
chrX: p
chrX: q
chr16: q
chr16: p
chrX: AR
chr16: gene desert
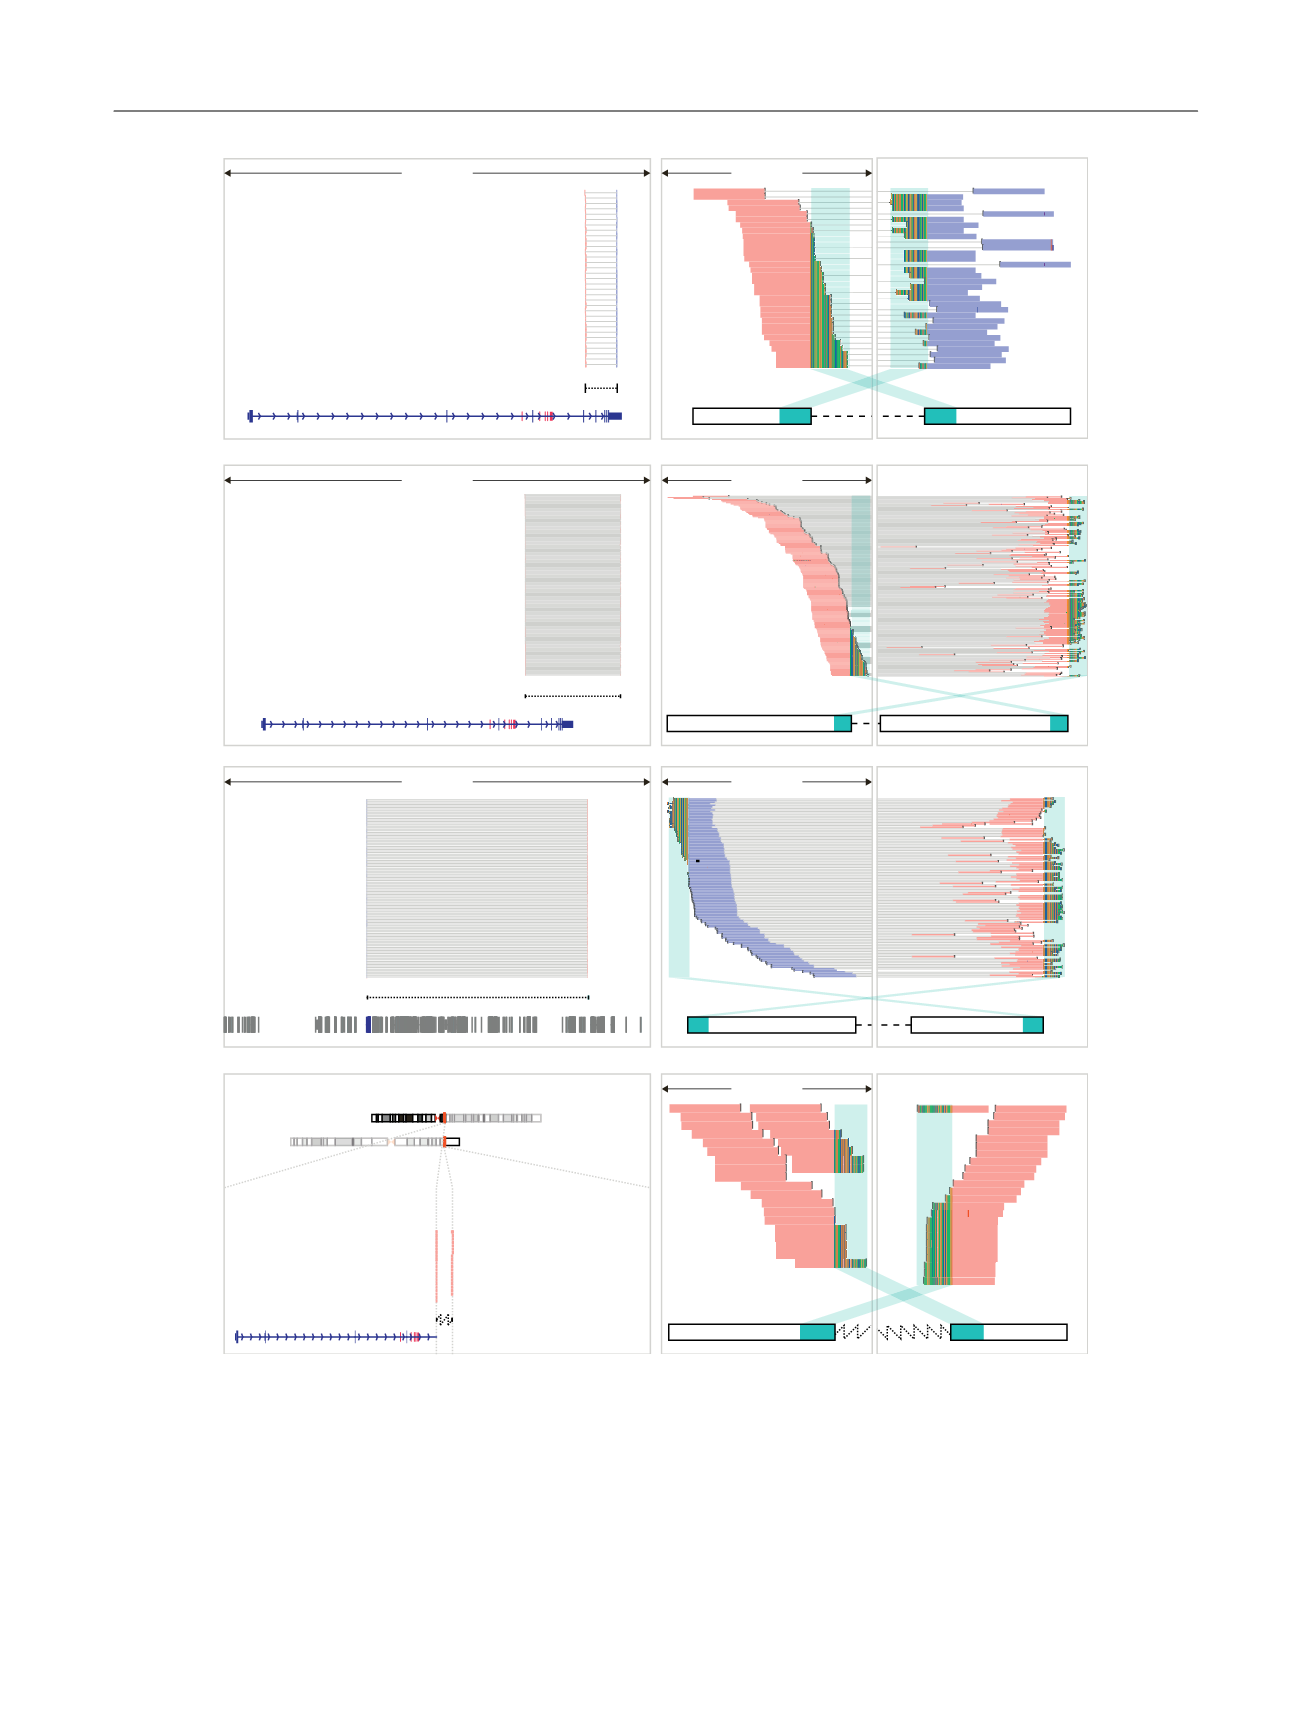
Fig. 2 – Different classes of intra-AR structural variation. (A) Sample 4120-P-2015352 carried a focal deletion overlapping the ligand-binding domain
(leftmost panel). Individual reads from each read-pair supporting the event are connected by a grey line and displayed in either orange (forward
orientation) or blue (reverse orientation). The 5
0
and 3
0
regions containing reads spanning the event are shown as black outlined boxes connected
with a dashed line. The AR structure is displayed at the bottom of the panel in dark blue with cryptic exons coloured red. The middle and rightmost
panels contain a magnified view of the 5
0
and 3
0
regions harbouring reads supporting the structural event. The bases of reads mapping partly to the
other end of the structural event are displayed to denote mismatches to the reference genome. The cyan colour indicates regions with a
complementary sequence to the partially mapped reads. (B) Sample 4118-P-2014611 harboured an inversion affecting the ligand-binding domain. (C)
Sample 3843-P-2013537 had a tandem duplication. The 5
0
end was located in intron 1 of the AR and the 3
0
end 18 Mb upstream in an intergenic
region. Colours are as for (A), except for other genes displayed in dark grey. (D) Sample 4038-P-2014253 presented with a translocation removing the
ligand-binding domain. The ideograms (leftmost panel) at the top display the locations of the 5
0
and 3
0
ends of the translocation, with the nonfused
regions of the chromosomes greyed out. Nomenclature for sample IDs separated by dashes: patient ID, letter P denoting a prostate cancer patient, and
unique biobank identifier.
E U R O P E A N U R O L O G Y 7 2 ( 2 0 1 7 ) 1 9 2 – 2 0 0
195