


 194 320

MLL2
,
AR
,
FOXA1
, and
APC
, were recurrently mutated. Clonal
mutations adjusted for CNVs were used to assess the
fraction of ctDNA in the cfDNA (average 0.39, range 0.067–
0.76, Supplementary Table 2). The ctDNA fraction correlated
with CTC enumeration via CellSearch (
r
= 0.54,
p
= 0.0037).
The use of paired-end sequencing allowed us to identify
structural variants commonly present in prostate cancer
[26]via split read and discordant read analysis (Supple-
mentary Fig. 4). A previously published algorithm
[27]was
applied in parallel with an in-house approach for calling and
visualising variants to minimise false positives. Intra-AR
structural variation was detected in 17/33 profiled cfDNA
samples, representing all four classes of structural variants
as exemplified by selected events in
Fig. 2 .Patient #4120
carried a deletion overlapping the ligand-binding domain
(LBD;
Fig. 2 A), with independent support provided by
calling CNVs based on coverage information (Supplemen-
tary Fig. 5A). Patient #4118 carried an inversion that flipped
the entire LBD
( Fig. 2 B). Patient #3843 harboured an 18-
Mb tandem duplication, originating in intron 1 of the AR
( Fig. 2C). However, the low-pass whole-genome sequencing
data for chromosome X suggest a more complex event
whereby spatially distant regions of the AR may have
merged (Supplementary Fig. 5B). In addition, for patient
#4038 a translocation removed the LBD, fusing chromo-
some X to a gene desert of chromosome 16
( Fig. 2 D).
Surprisingly, the majority of cfDNA samples with intra-AR
structural variants harboured multiple AR events (11/17,
Fig. 3 ), with focal alterations frequently affecting either the
cryptic exon region or the LBD.
To determine the expression of ARVs directly from CTCs,
we developed and validated an RNA-seq approach (Supple-
mentary Fig. 6). To verify the presence of CTCs, conventional
CellSearch processingwas performed to count the number of
CTCs per 7.5 ml of blood. In total, 28/34 (82.3%) blood
samples had detectable CTCs (median 72, IQR 15–239). This
allowed us to infer expression of full-length AR and seven
isoforms (AR45, AR-V1, AR-V2, AR-V3, AR-V5, AR-V7, and
AR-V9). Fourteen out of 15 unique patients with intra-AR
structural events expressed ARVs (Supplementary Fig. 7),
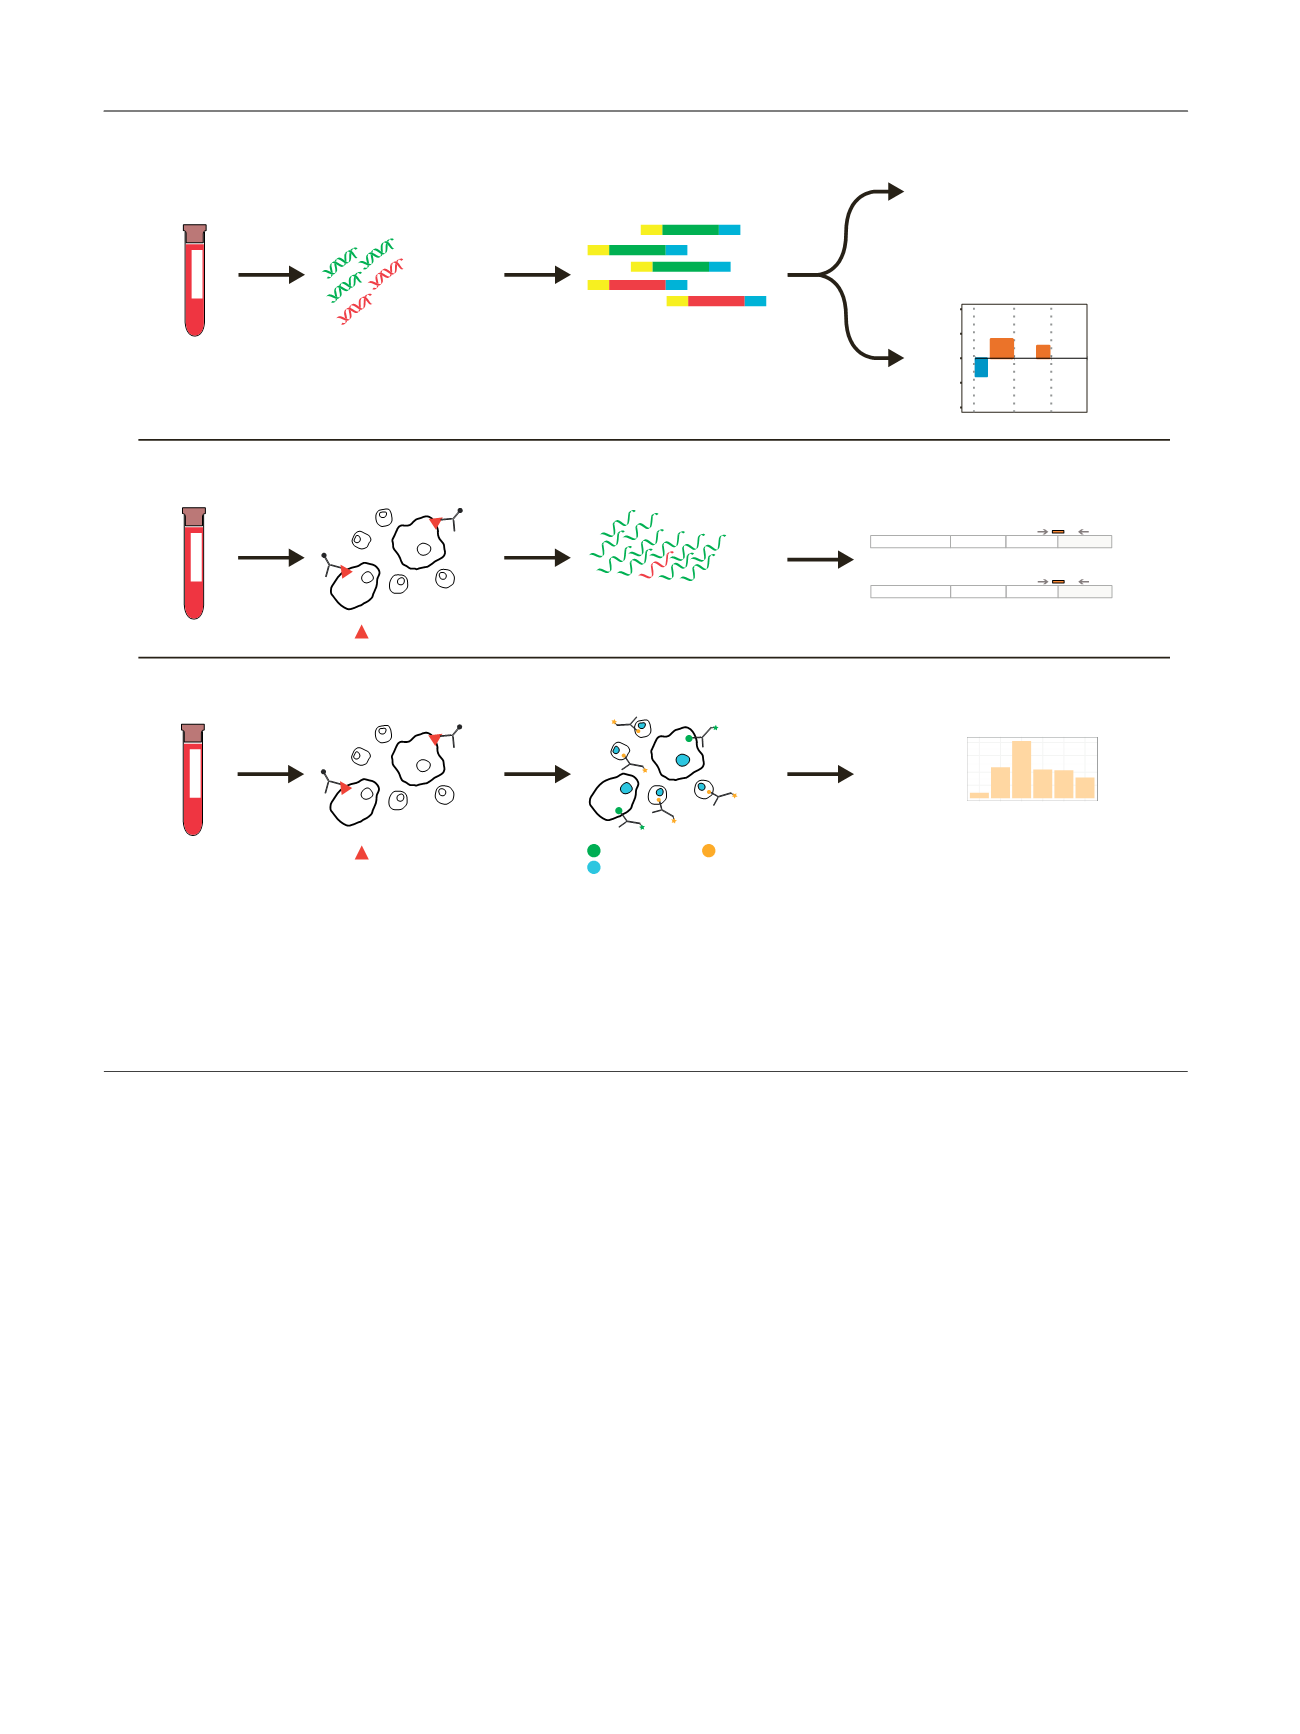
[(Fig._1)TD$FIG]
Draw blood
Normal DNA
Tumor DNA
Extract cell-free DNA
Targeted sequencing
TP53 mutation
SPOP mutation
Intronic AR deletion
etc
CITRATE
Low-pass WGS
8 9 10
−2
−1
0
1
2
Chromosome
Log2 Ratio
CellSave
EDTA
Circulating tumour
cell enrichment
AR exon-junction RNAseq
Cytokeratin CD45
Dapi
1
2
3
CE3
AR-V7
1
2
3
CE5
AR-V9
etc
EpCAM
Library prep
Normal RNA
Tumor RNA
Extract total RNA
5
25
200
1000
Nbr CTCs
Patient ID
Circulating tumour
cell enrichment
Counting CTCs
Draw blood
Draw blood
EpCAM
Labelling & staining
A)
B)
C)
Fig. 1 – Multilevel analysis of liquid biopsies. Circulating tumour DNA and AR splice variant expression were analysed in liquid biopsy samples. (A) Cell-
free DNA was extracted from plasma. Library preparation was subsequently performed, preparing the cell-free DNA for Illumina sequencing. Illumina
adapters are displayed with yellow or blue colours. Each DNA library was used for both targeted sequencing and low-pass whole-genome sequencing.
Targeted sequencing was applied to (1) detect mutations in genes commonly mutated in prostate cancer and (2) investigate the presence of intra-AR
structural variation. Low-pass whole-genome sequencing was performed to identify copy-number alterations throughout the whole genome. (B)
EpCAM-positive circulating tumour cells (CTCs) were enriched on a CellSearch platform. Total RNA was extracted and AR exon-junction RNAseq was
performed to determine AR splice variant expression. (C) To verify the presence of CTCs, the same enrichment was performed as in (B), but cells were
labelled, stained, and counted.
E U R O P E A N U R O L O G Y 7 2 ( 2 0 1 7 ) 1 9 2 – 2 0 0
194