


 196 320

suggesting a correlation between intra-AR structural varia-
tion and ARV expression. The only patient with intra-AR
structural variation without detectable ARVs was patient
#4175, who rapidly progressed on abiraterone treatment
(4.7 mo).
Next we performed ARV analysis on CTC fractions (
n
= 30)
from 26 patients. For 18/26 patients we collected blood at
the start (ie, baseline) of abiraterone or enzalutamide, and
four cases also had blood sampled at disease progression
(Supplementary Fig. 8). For the other 8/26 patients we only
collected blood at the time of progression on abiraterone or
enzalutamide and a new agent had to be initiated. Patients
were stratified into three categories according to the time to
treatment failure
( Fig. 4). The average number of reads
from RNA sequencing was 3672 (IQR 1272 –5970 ;
Supplementary Table 5). ARVs were detected in 17/30
(56.6%) of the samples analysed, with 15/26 (57.7%) patients
being ARV-positive, of whom 13/15 (86.7%) had
<
6 mo of
benefit from their therapy (Fisher’s exact test,
p
= 0.0115).
ARV expression was heterogeneous, with 10/15 (66.7%)
patients expressing several ARVs. AR-V7 was the most
frequently occurring splice variant (12/15 patients), fol-
lowed by AR-V3 (11/15), AR45 (10/15), AR-V9 (6/15), AR-V1
(5/15), AR-V2 (3/15), and AR-V5 (3/15). However, median
AR-V3 expression was 3.5-fold higher compared to AR-V7
(Wilcox signed rank,
p
= 0.0029; Supplementary Fig. 9). In
addition, two poorly responding patients were AR-V7–
negative while expressing AR-V3.
Baseline ARV data were available for 18 patients
(abiraterone
n
= 16, enzalutamide
n
= 2). Patient #4042
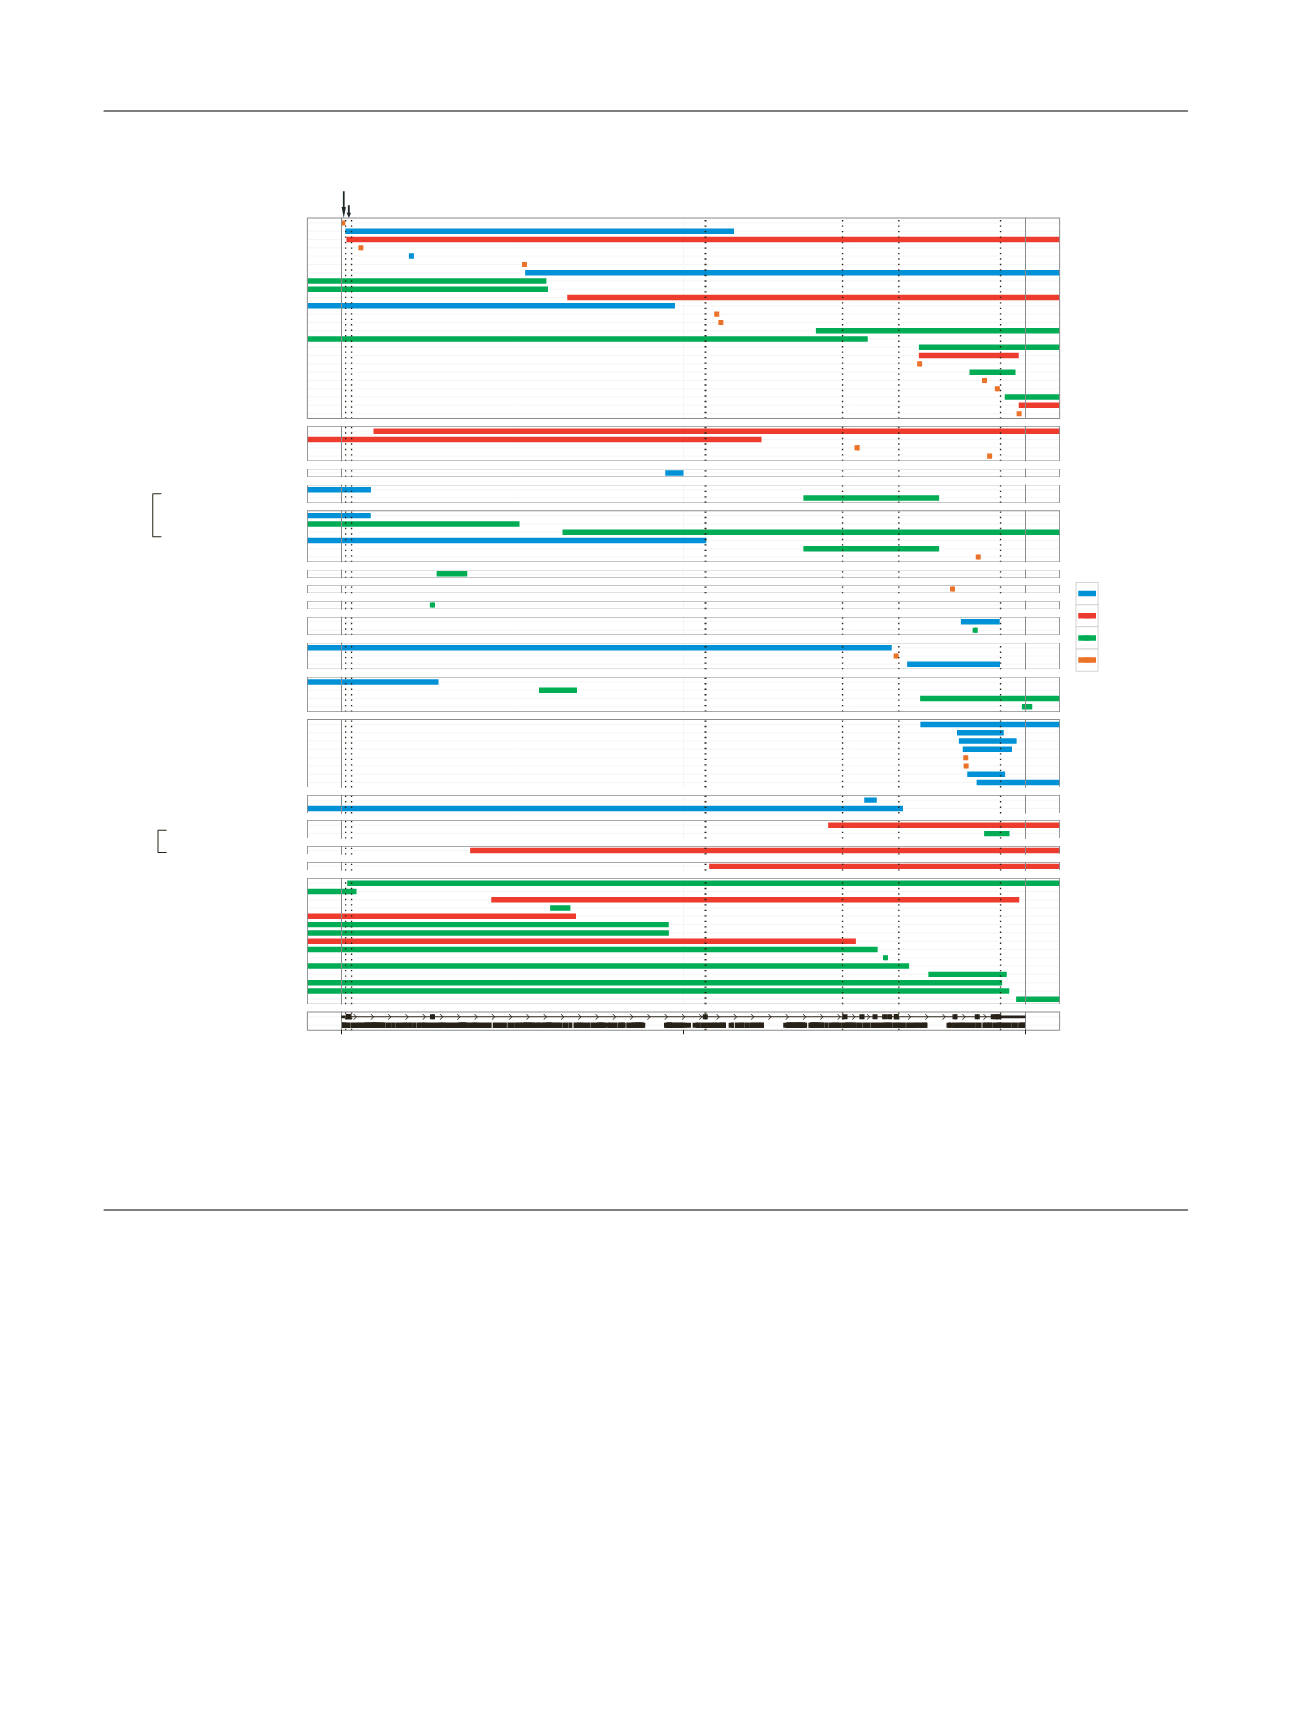
[(Fig._3)TD$FIG]
3542−P−2014235
3843−P−2013537
3883−P−2013569
3885−P−2013618
3885−P−2014159
3886−P−2013651
4038−P−2014253
4042−P−2014339
4045−P−2014404
4069−P−2014174
4118−P−2014611
4120−P−2015352
4172−P−2015026
4174−P−2014501
4174−P−2015066
4175−P−2014393
4213−P−2015142
Bait_regions
AR_exons
66763874
66857168
66950461
TYPE
DEL
DUP
INV
TRA
Intron 1
Intron 2
CE-region
LBD-region
5’-UTR
3’-UTR
Chromosome X
Exon 1
Exon 2
Fig. 3 – Overview of intra-AR structural variation. Each panel shows intra-AR variation for one profiled cfDNA sample, except for the bottom panel. The
bottom panel illustrates the locations of the AR coding exons and the baited regions that were enriched and sequenced. Horizontal lines denote start
and/or stop for a structural event. Structural variations are coloured according to the legend. Intra-AR relevant annotations are given for the top
panel. Brackets denote cfDNA samples originating from the same patient, sampled at different time points. CE = cryptic exon; LBD = ligand-binding
domain; DEL = deletion; DUP = tandem duplication; INV = inversion; TRA = translocation.
E U R O P E A N U R O L O G Y 7 2 ( 2 0 1 7 ) 1 9 2 – 2 0 0
196