


 253 320

35 studies, respectively. Nineteen studies also added MRSI.
An endorectal coil was used in 18 studies. The definition of
positive mpMRI varied across studies. The PI-RADS v1 score
was used in 12 studies, a five-level subjective (Likert) score
was used in eight studies, and one study reported data based
on the two scoring systems. In-house criteria were used in
13 studies for defining positive mpMRI, and five studies used
a dichotomous definition. Nine studies did not report on the
criteria for positive mpMRI. No study used the PI-RADS v2
score.
Regarding the reference standard, TRUS-guided biopsies
were used in 39 studies, TTP biopsies in six studies, and
mixed TRUS-guided and TTP biopsies in two studies. In one
study, the biopsy approachwas unclear. The number of cores
per biopsy procedure was 16 in 30 studies,
>
16 in nine
studies, and variable among patients in three studies. For six
studies, the number of biopsy cores taken was unclear.
3.4.
NPV of prebiopsy mpMRI
At patient level, the median biopsy positivity rate (ie, cancer
prevalence) was 50.4% (IQR, 36.4–57.7%) for overall cancer
and 32.9% (IQR, 28.1–37.2%) for csPCa
( Table 2). The median
mpMRI NPV was 82.4% (IQR, 69.0–92.4%) for overall cancer
and 88.1% (IQR, 85.7–92.3) for csPCa. NPV significantly
decreased when cancer prevalence increased, both for
overall cancer (
r
= –0.64,
p
<
0.0001) and csPCa (
r
= –0.75,
p
= 0.032;
Fig. 3 ). In addition, NPV was highly dependent on
the definition used for csPCa, with differences of up to 21%
when several definitions were used in the same dataset
[12,13,38,47,48].
Cancer prevalence tended to be higher and mpMRI NPV
lower in the biopsy-naı¨ve group as compared with the
repeat biopsy group, inmenwith positive DRE as compared
with men with negative DRE and when an endorectal coil
was not used
( Table 3 ). There were no clear differences in
the prevalence and NPV of the other analysed subgroups
(TRUS-guided vs TTP biopsy, biopsy procedures with
16 cores vs
>
16 cores;
Table 3). However, comparisons
must be interpreted with care, due to the small number of
studies in some subgroups. In patients with a PSA level
of 10 ng/ml, the median NPV for overall PCa was 86.3%
(IQR, 73.3–93.6%) for a median cancer prevalence of 35.4%
(IQR, 27.6–42.5%).
[(Fig._1)TD$FIG]
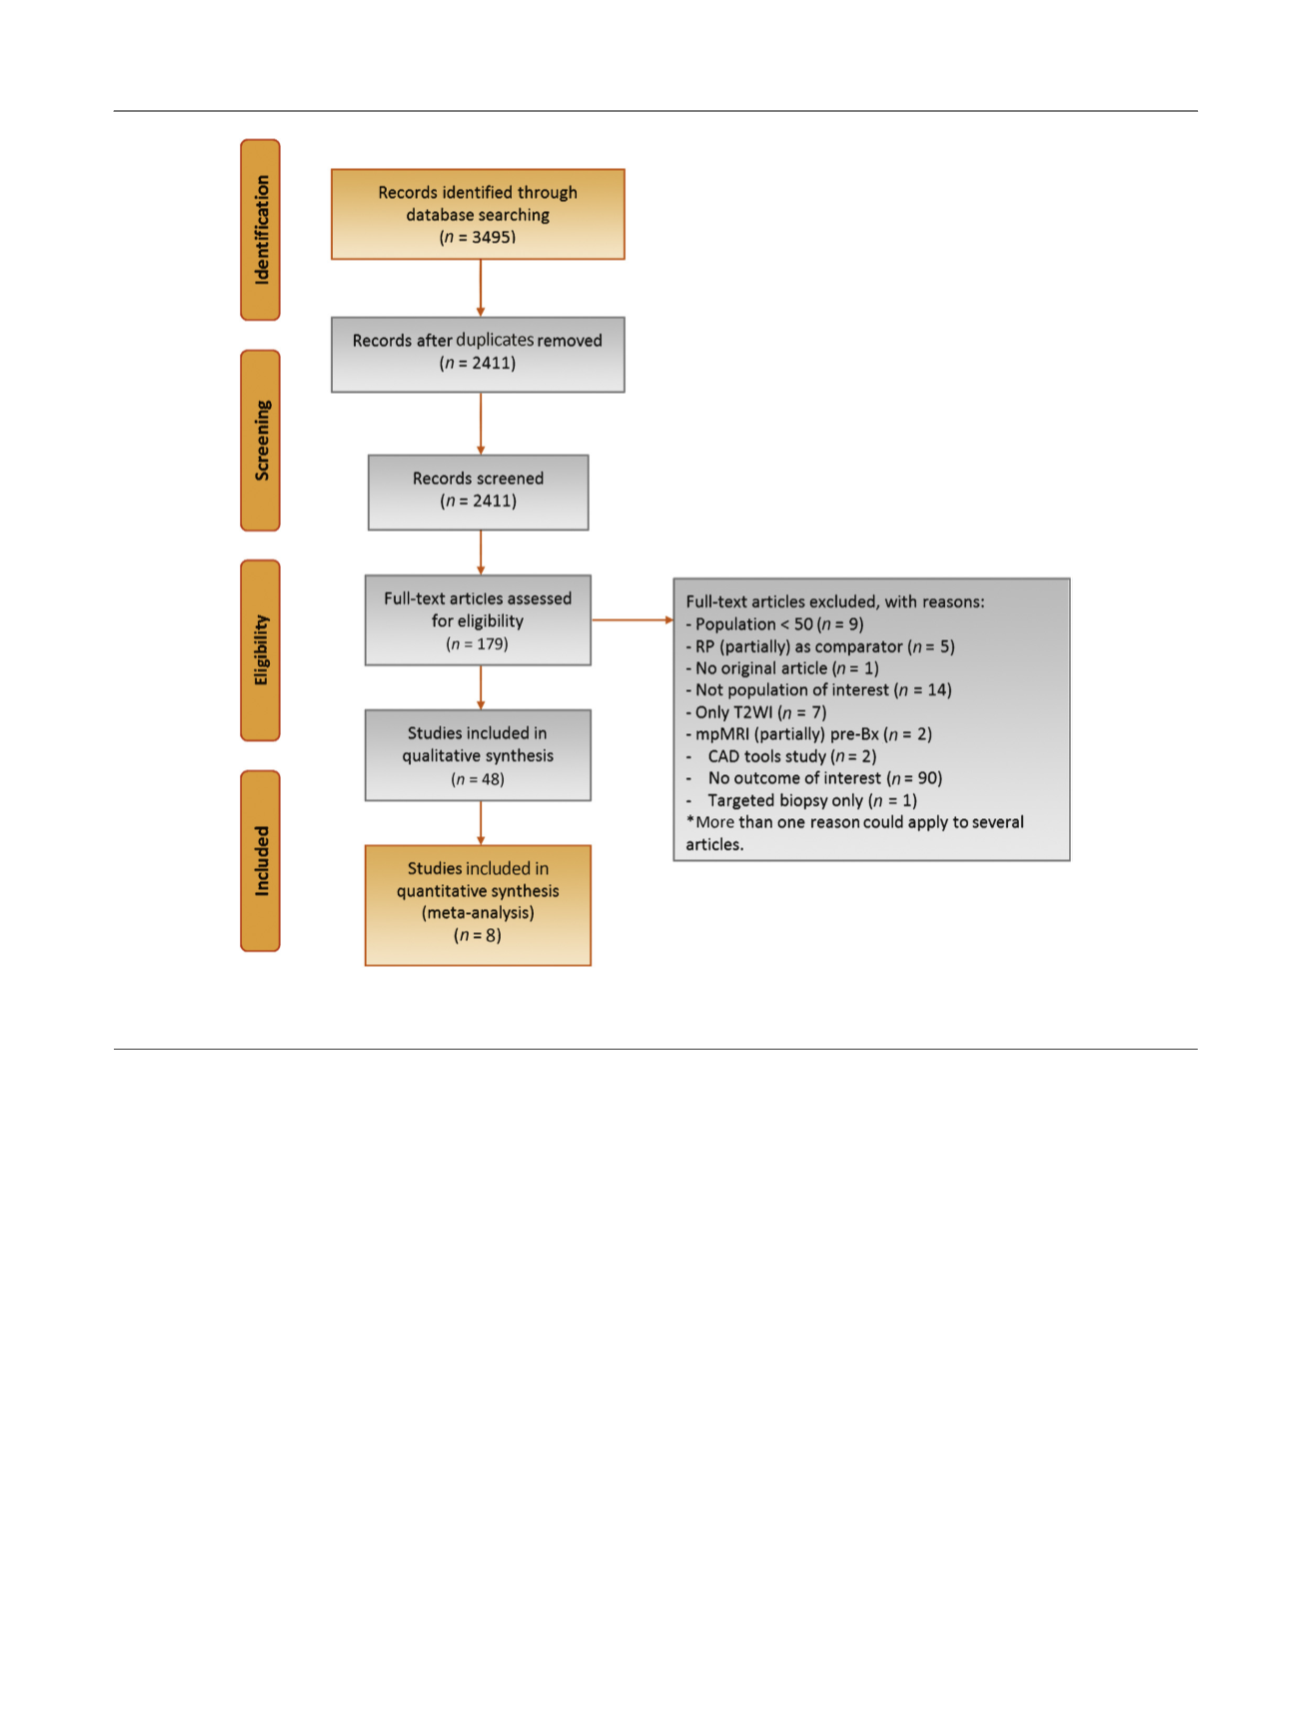
Fig. 1 – Preferred Reporting Items for Systematic Reviews and Meta-analysis flow chart. Bx = biopsy; CAD = computer-aided diagnosis;
mpMRI = multiparametric magnetic resonance imaging; RP = radical prostatectomy; T2WI = T2-weighted imaging.
E U R O P E A N U R O L O G Y 7 2 ( 2 0 1 7 ) 2 5 0 – 2 6 6
253