

 254 320

[(Fig._2)TD$FIG]
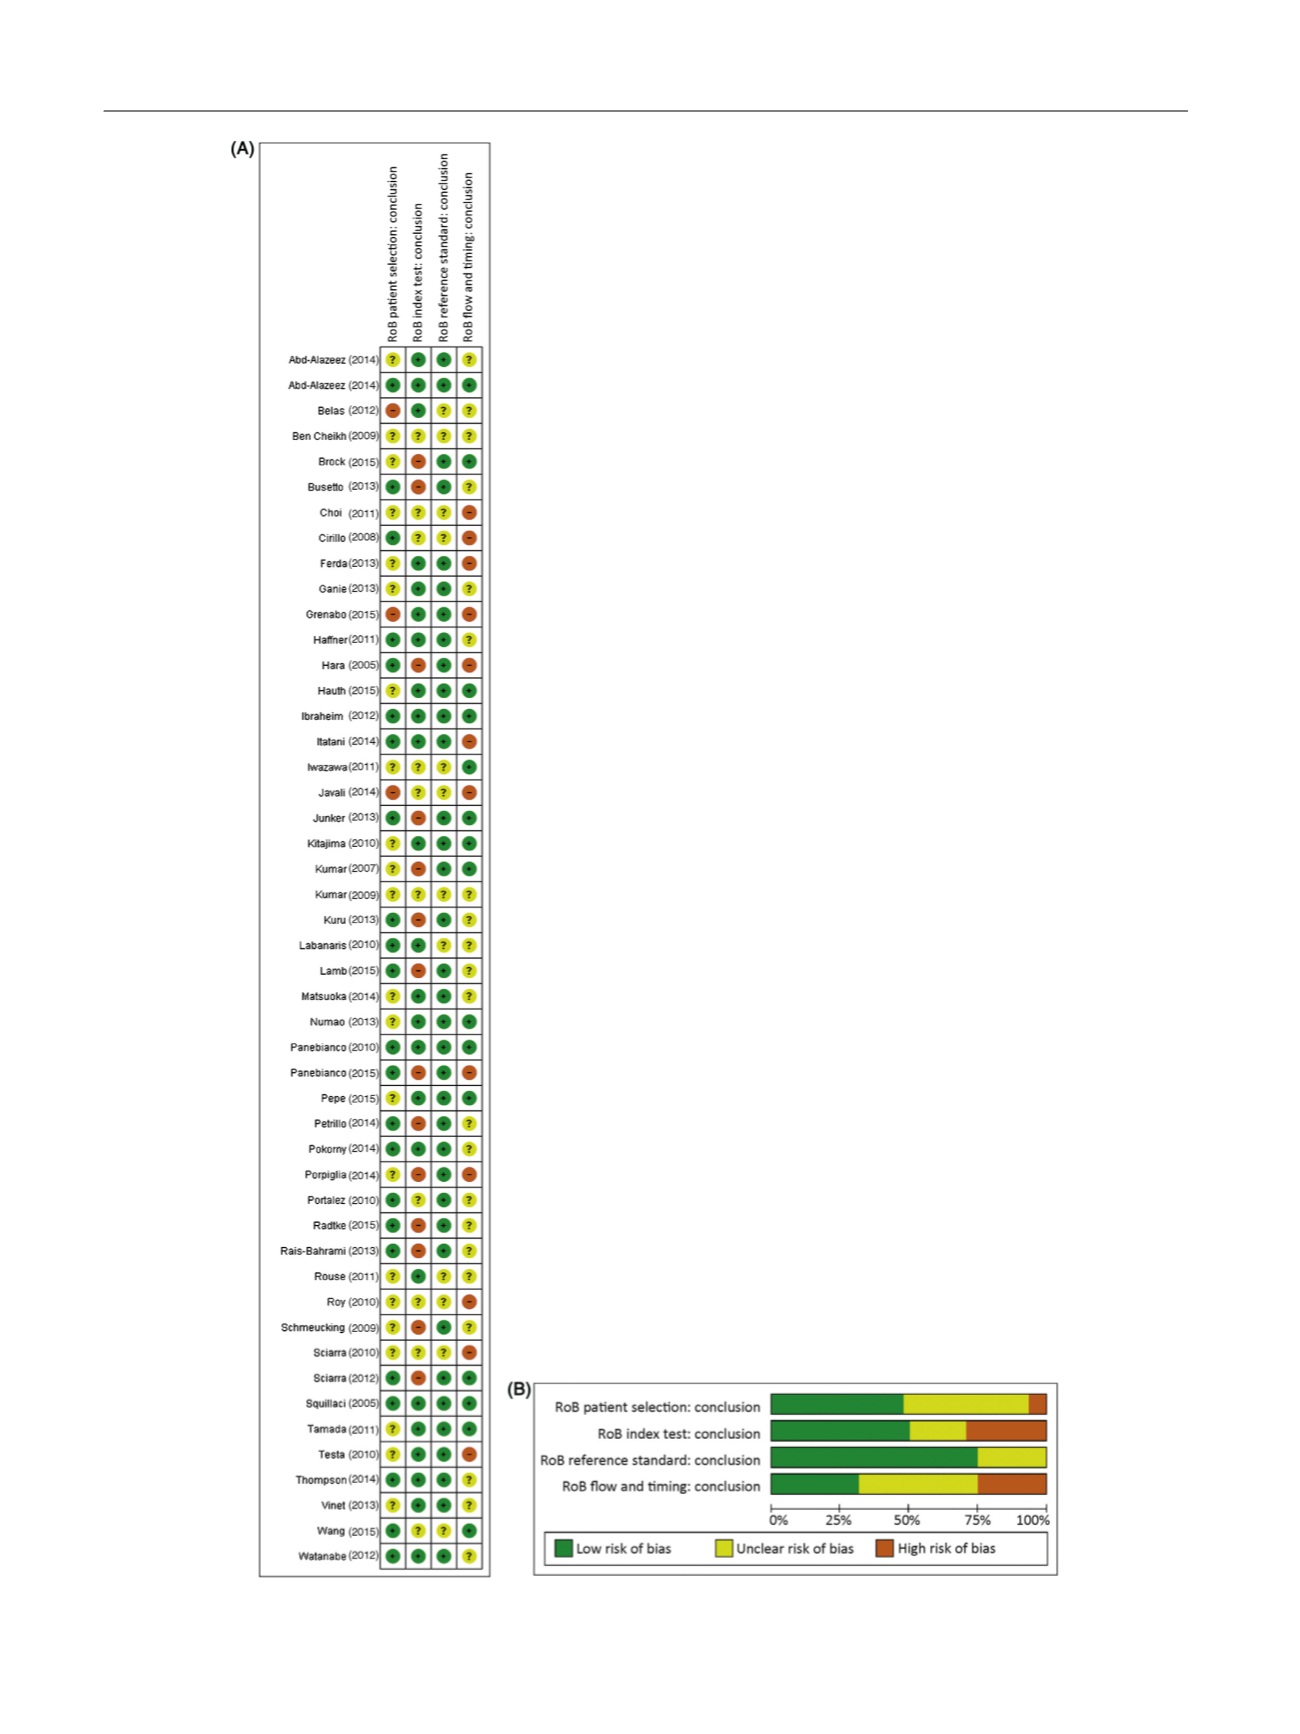
Fig. 2 – (A) Assessment of the risk of bias for included studies. (B) Risk of bias summary graph. RoB = risk of bias.
E U R O P E A N U R O L O G Y 7 2 ( 2 0 1 7 ) 2 5 0 – 2 6 6
254


 254 320


 254 320
[(Fig._2)TD$FIG]
Fig. 2 – (A) Assessment of the risk of bias for included studies. (B) Risk of bias summary graph. RoB = risk of bias.
E U R O P E A N U R O L O G Y 7 2 ( 2 0 1 7 ) 2 5 0 – 2 6 6
254