


 260 320

3.5.
Meta-analysis
3.5.1.
NPV and PPV for overall PCa
Eight studies reported NPV at patient level for overall PCa
and fulfilled the inclusion criteria for meta-analysis
( Table 4)
[22,25,38,41,43,46,56,57].
Seven studies used a score of 3/5 for defining positive
mpMRI
( Fig. 4 Aand B)
[22,25,38,43,46,56,57] . Fig. 4 Cshows
the conditional probability plot of 1 – NPV and PPV as a
function of overall PCa prevalence.
Table 5shows NPV and
PPV estimates for the given values of PCa prevalence.
Only three studies used a score of 4/5 for defining
positive mpMRI
( Table 4)
[41,46,57] ,and a formal meta-
analysis could not be performed.
3.5.2.
NPV and PPV for Gleason 7 cancers
Only one study reporting NPV at patient level for Gleason
7 cancers met the selection criteria for inclusion in the
meta-analysis. It reported NPV and PPV of 87.9% and 45.1%,
respectively, for a prevalence of 29.3%
( Table 4)
[46].
3.6.
Discussion
3.6.1.
Principal findings
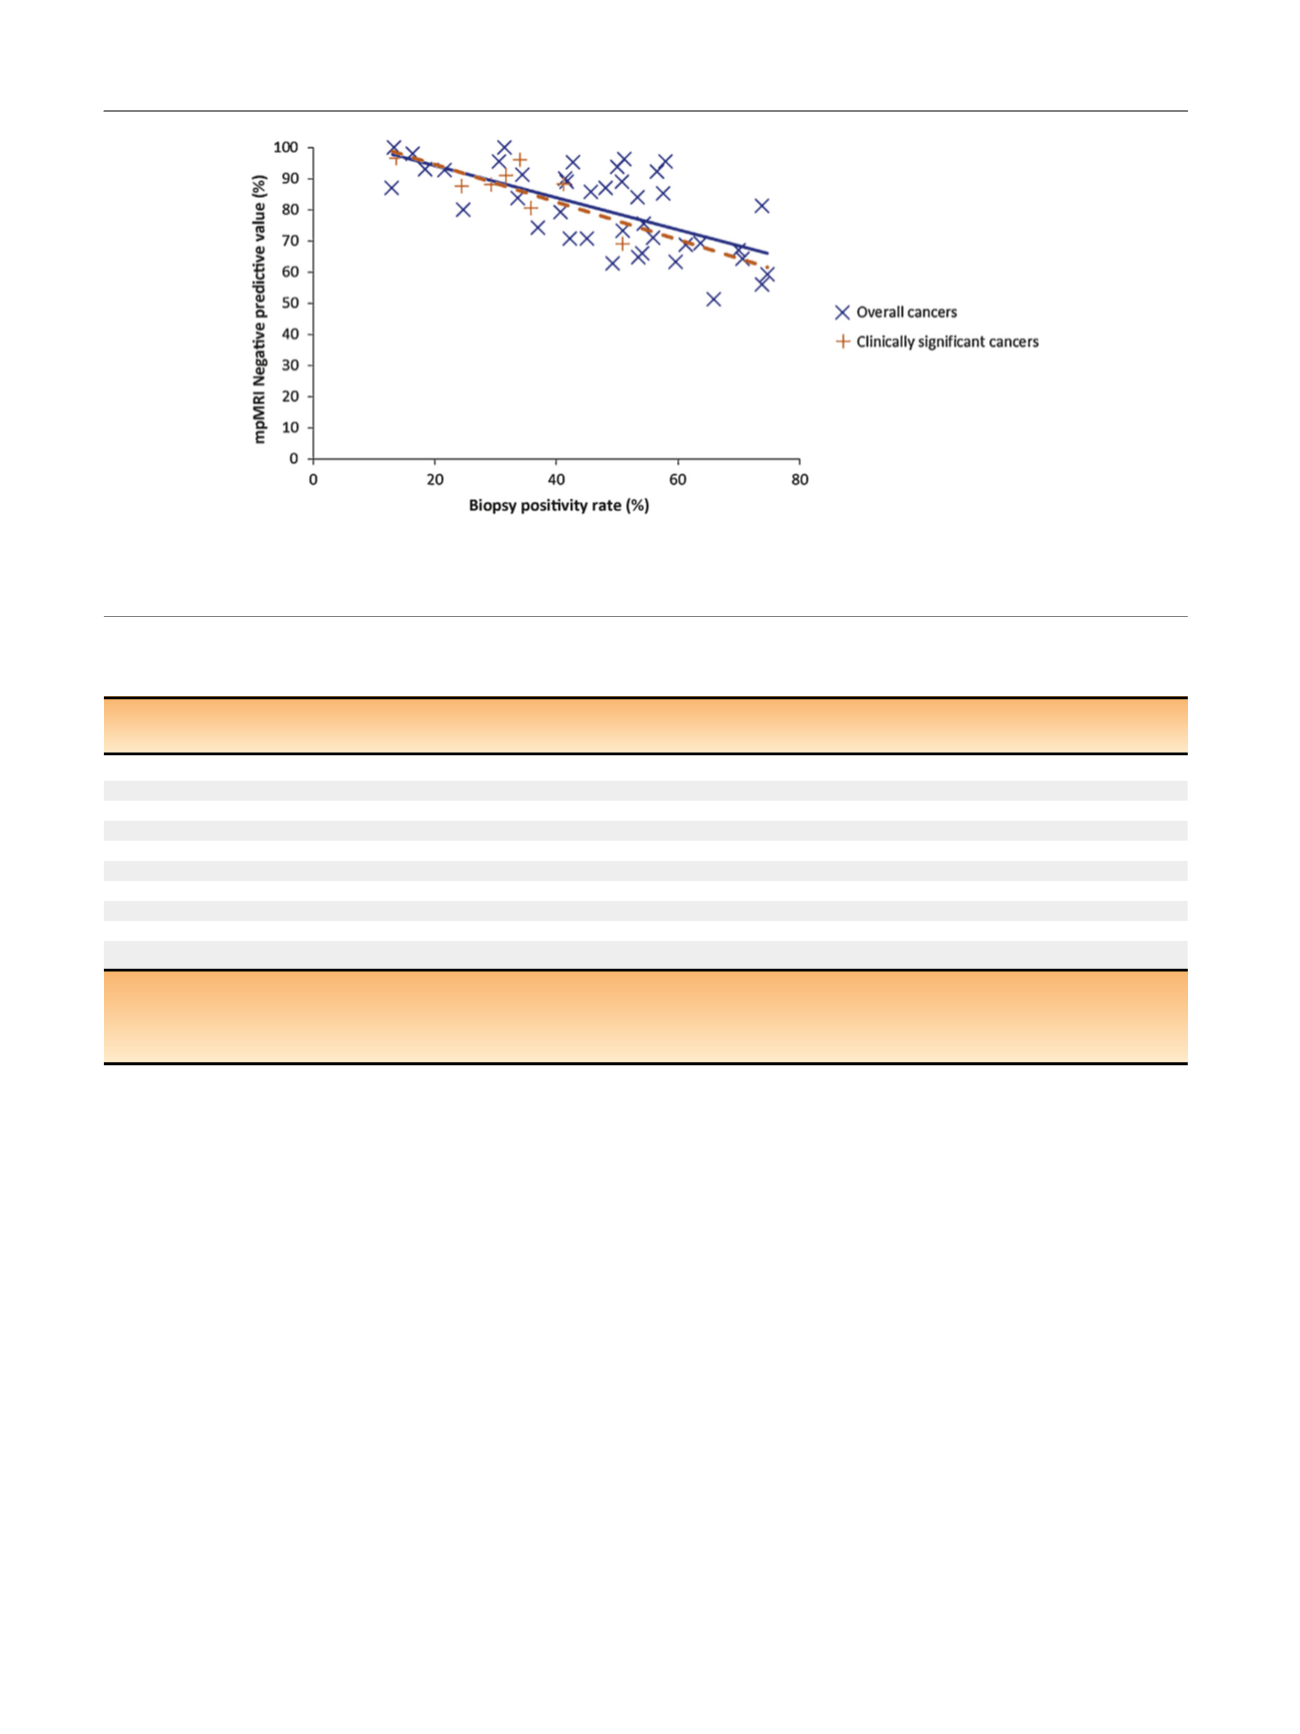
We observed a large variability in reported NPV. Many
factors, such as differences in mpMRI protocols, definition
of negative mpMRI, or biopsy protocols, can explain this
variability. However, two major causes of variability must
be pointed out. First, the cancer prevalence was highly
variable, ranging at patient level from 13% to 74.7% for
overall PCa, and from 13.7% to 50.9% for csPCa. This
variability was observed in both the biopsy-naı¨ve and the
repeat biopsy setting. As NPV depends on prevalence, this
had a major impact on reported NPV
( Fig. 3). Second, the
definition of csPCa was highly variable from one series to
another, and differences of up to 21% could be observed in
NPV when different definitions of csPCa were used in the
same dataset
[12,13,38,47,48].
To account for clinical heterogeneity and to further
explore the clinical relevance of the results, we carefully
selected studies for inclusion in the meta-analysis based on
[(Fig._3)TD$FIG]
Fig. 3 – Negative predictive value of prebiopsy multiparametric MRI as a function of cancer prevalence (blue crosses: overall prostate cancer; red
crosses: clinically significant prostate cancer). The blue line is the correlation line for overall prostate cancer; the red dotted line is the correlation line
for clinically significant prostate cancer. mpMRI = multiparametric magnetic resonance imaging; MRI = magnetic resonance imaging.
Table 3 – Reported ranges of negative predictive values for prebiopsy multiparametric MRI
Nb of
studies
Median PCa
prevalence
Median
mpMRI NPV
Nb of
studies
Median csPCa
prevalence
Median
mpMRI NPV
Biopsy-naı¨ve patients
8
51.4% (45.5–56.7)
69.9% (64.2–78)
1
35.8% (NA)
80.4% (NA)
Repeat biopsy
14
42% (35.1–52.6)
82.6% (75.5–93.1)
3
24.4% (19.1–32.8)
88.2% (87.9–92.3)
TRUS-guided biopsy
36
49.7% (34.3–57.7)
84.6% (68.6–92.8)
4
28.1% (21.7–36.5)
89.3% (82.9–92.4)
TTP biopsy
4
53.8% (47.5–57.8)
73.6% (72–78.7)
2
31.6% (30.5–32.8)
92% (89.9–94)
Biopsy with 16 cores
28
48.7% (39.2–54.8)
81.9% (66.8–89.3)
5
28.1% (21.8–36.5)
89.3% (82.9–92.4)
Biopsy with
>
16 cores
5
56.6% (51–61.3)
81.1% (73.1–92.2)
2
31.7% (30.5–32.8)
92% (89.9–93.9)
Positive DRE
1
73.9% (NA)
56% (NA)
0
–
–
Negative DRE
6
36% (34.6–46.8)
82.7% (74.2–93.1)
0
–
–
Endorectal coil
17
41.7% (30.6–55.9)
92.8% (79.3–95.4)
1
31.7% (NA)
91% (NA)
No endorectal coil
22
50.9% (41.7–56.1)
77.7% (69.5–86.6)
7
34% (26.9–46.1%)
87.9% (78.2–92.1)
PCa = prostate cancer; csPCa = clinically significant prostate cancer; NPV = negative predictive value; TRUS = transrectal ultrasound; TTP = template
transperineal; DRE = digital rectal examination; PSA = prostate-specific antigen; NA = not applicable; mpMRI = multiparametric magnetic resonance
imaging; MRI = magnetic resonance imaging; Nb = number.
Intervals in parenthesis are interquartile ranges.
E U R O P E A N U R O L O G Y 7 2 ( 2 0 1 7 ) 2 5 0 – 2 6 6
260