


 224 320

[(Fig._2)TD$FIG]
Karaköse2014 [21]
Xu 2014 [26]
Knoll 2010 [22]
Yamaguchi 2011 [27]
Mishra 2011 [24]
GiusƟ2007 [11]
+
+
–
?
–
?
–
?
?
–
–
–
–
–
–
–
–
–
–
–
+
+
+
+
+
?
?
?
?
+
+
+ –
–
–
+
+
+
–
–
–
–
–
–
–
–
–
–
–
–
+
–
+
–
–
–
–
–
–
–
–
–
–
–
–
–
–
–
–
–
–
–
–
+
?
Low risk
High risk
Unclear risk
Tepeler2014 [28]
Cheng 2010 [19]
?
+
+ ?
–
? ?
+
+
– +
–
–
+
?
Low risk
(A)
(B)
(C)
High risk
Unclear risk
–
+
?
Low risk
High risk
Unclear risk
Miller 2014 [32]
?
Karatag2014 [31]
Desai 2013 [30]
Desai 2013 [8]
Desai 2013 [20]
Abdelhafez2013 [18]
BhaƩu2014 [29]
Zimmermans2012 [33]
Lu 2013 [23]
Sung 2006 [25]
?
?
?
?
?
?
?
?
?
?
–
–
?
?
?
?
+
? +
?
?
?
+
+
+ +
? +
+
? ?
? ? ?
?
? +
? ?
+
+
+
+
+
+
+
+
+
+
+
+
+
+
+
+
+
+
+
?
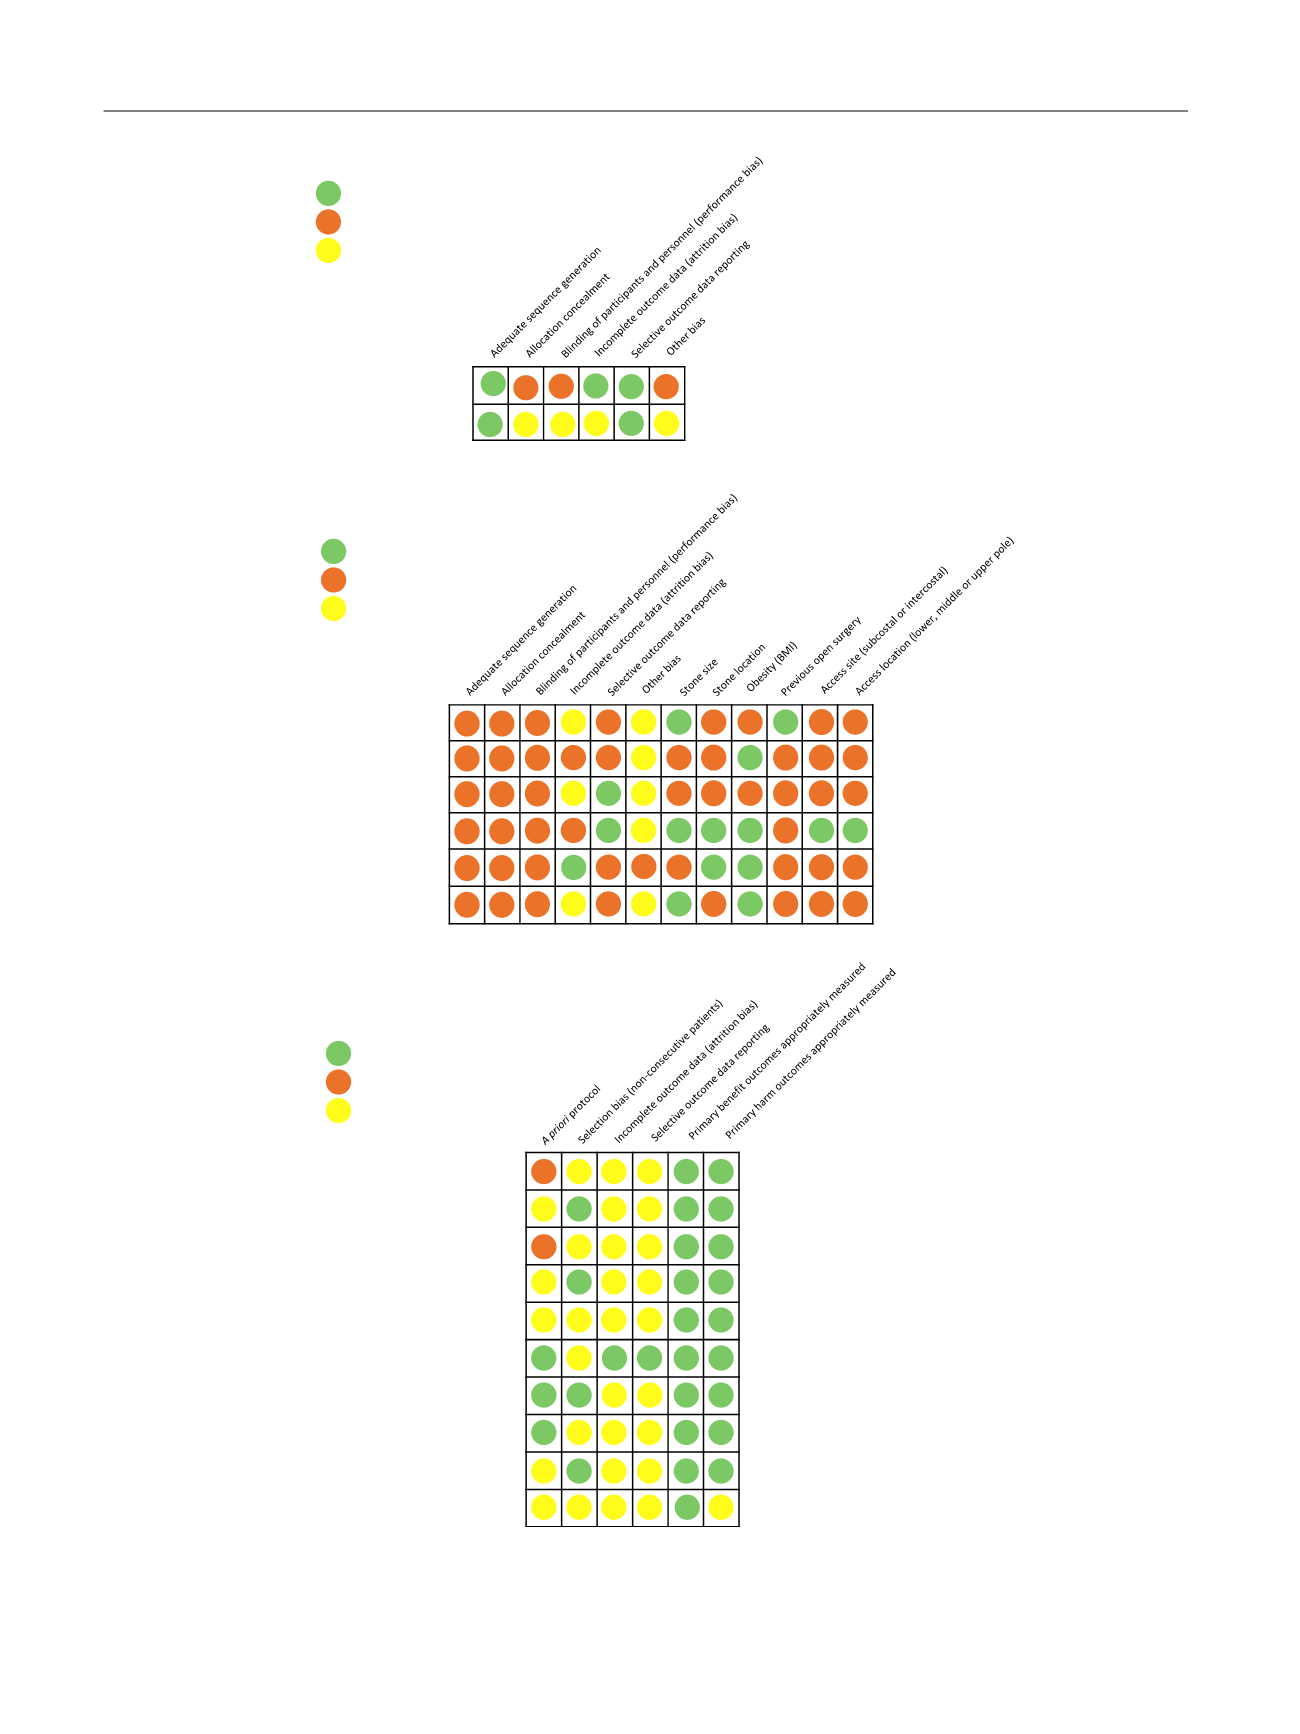
Fig. 2 – Risk of bias and confounding assessment summary
[5_TD$DIFF]
. (A) Risk of bias assessment for randomized controlled trials. (B) Risk of bias and
confounding assessment for non-randomized comparative studies. (C) Risk of bias assessment for case series. Green circle = low risk of bias or
confounding; red circle = high risk of bias or confounding; yellow circle = unclear risk of bias or confounding.
E U R O P E A N U R O L O G Y 7 2 ( 2 0 1 7 ) 2 2 0 – 2 3 5
224