


 297 320

in vitality (
p
trend
<
0.001) with exercise
( Fig. 2). Sensitivity
analysis was conducted using complete cases
[22]with no
change in the results for vitality and although for fatigue
there was a significant main effect for time (
p
= 0.003) with
the magnitude of difference within groups over time
similar, with the reduction in sample size and hence
statistical power the only significant difference was for ART
(
p
= 0.032).
3.3.
Other measures and adverse events
For cardiorespiratory fitness, there was no significant
interaction (
p
= 0.216) but a significant effect for time
(
p
<
0.001) with fitness improved (
p
= 0.008) in ILRT at
12 mo by 14 s and in ART (
p
<
0.001) by 13 s at 12 mo,
with the change in DEL of 11 s at 12 mo approaching
significance (
p
= 0.063;
Table 4). Notably, there was no
change in cardiorespiratory fitness during the nonexercise
period for DEL. For muscle strength, there was a significant
interaction (
p
<
0.001) with strength progressively increas-
ing at 6 mo and 12 mo (
p
<
0.001) in ILRT, increasing during
the initial 6-mo supervised phase in ART (
p
<
0.001) with no
change thereafter, and no change between baseline and
6 mo in DEL but a difference by 12 mo following exercise
(
p
<
0.001). No adverse effects from exercise resulted in any
participants having to withdraw from the study. Two men
in ILRT withdrew within the 1st 6 mo due to compressed
spinal discs and shoulder issues, although the person
developed shoulder issues prior to commencing exercise
training. Two men in ART had cardiovascular problems, one
in the 1st 6 mo and one in the 2nd 6 mo, with one requiring
heart bypass surgery while another participant in ART
developed back pain. Two men withdrew from DEL in the
1st 6 mo due to difficulty walking and the other required
back surgery.
4.
Discussion
To our knowledge, this is the first year-long RCT to evaluate
the effects of different exercise modalities on fatigue in
prostate cancer patients undergoing ADT. There were two
important findings: (1) all exercise modalities (resistan-
ce + impact loading, aerobic + resistance, aerobic only) had
a beneficial effect on fatigue and vitality, and (2) those with
the highest levels of fatigue and lowest vitality improved
the most with exercise.
A substantial proportion of PCa patients will receive ADT
as part of their treatment. Prevalence of clinically-relevant
fatigue in these patients has been reported as 40%
[2,23]. The fatigue scores from the EORTC QLQ-C30 in our
cohort are similar to the reference values for men with PCa
aged 60–69 y (25.2 26.6)
[24] .Vitality has also been shown
to decline during ADT. In a population-based sample of men
with PCa followed for 1 y, Alibhai et al
[25]reported vitality
was substantially lower in ADT-treated compared with non-
ADT patients. A more recent prospective study also showed
changes in vitality following 12 mo of ADT with rapid declines
during the initial 3 mo
[26] .Short-term exercise trials have shown the efficacy of
combined resistance and aerobic exercise, or as sole training
modes, to improve fatigue in men undergoing radiation
therapy/ADT for PCa
[5,7,8]. We have also shown improve-
ments in vitality following a 12-wk exercise intervention
[5]. Here we extend these findings by providing data on the
largest exercise trial undertaken with men undergoing ADT
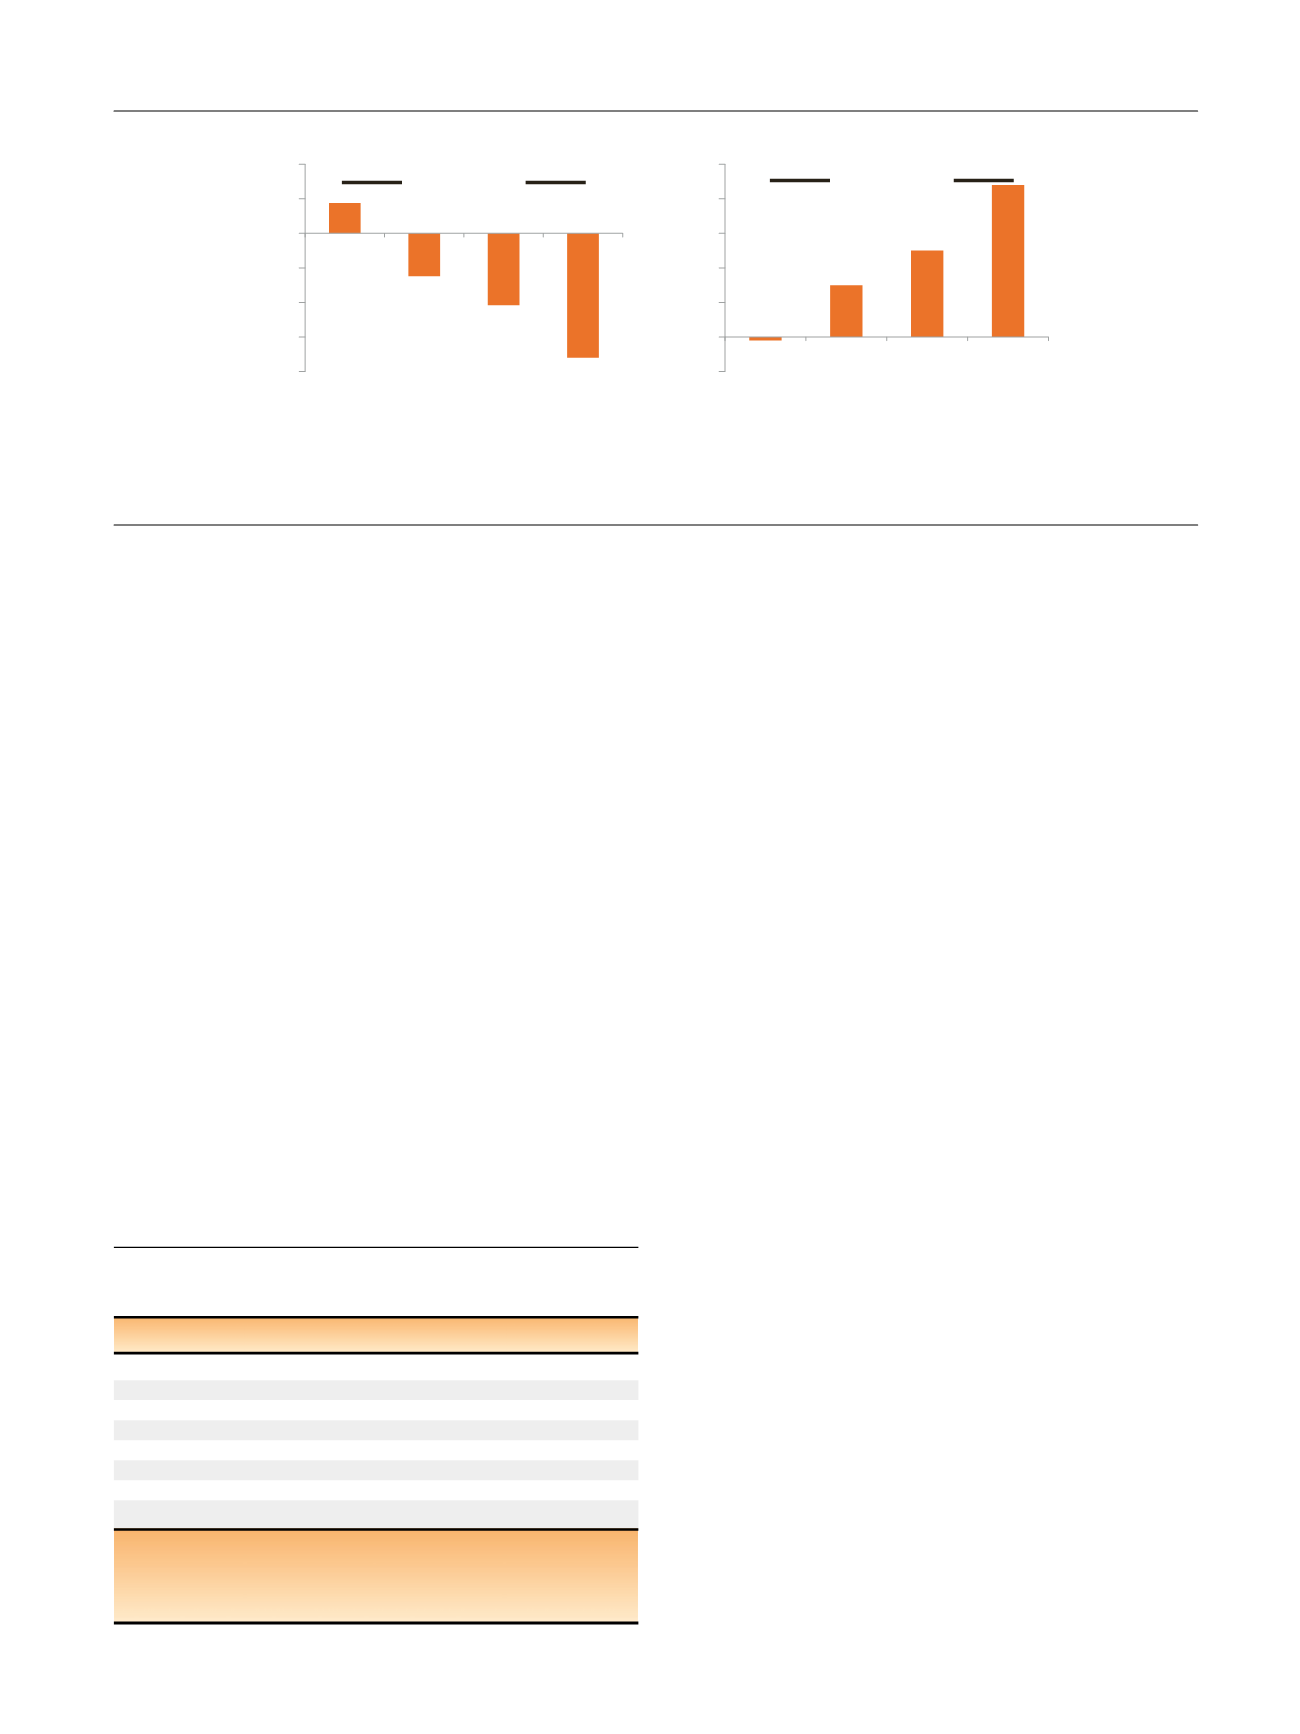
[(Fig._2)TD$FIG]
–20
–15
–10
–5
0
5
10
FaƟgue
–2
0
2
4
6
8
10
Vitality
Q1 Q2 Q3 Q4
Q1 Q2 Q3 Q4
p
< 0.001
p
< 0.001
Fig. 2 – Change in fatigue (European Organisation for Research and Treatment of Cancer Quality of Life Questionnaire-Core 36) and vitality (Short
Form-36) with 6–12 mo exercise according to baseline status. Quartile 1 (Q1) least fatigued and highest vitality to quartile 4 (Q4) most fatigued and
least vitality. Fatigue cut-points were 22 for Q2, 33 for Q3, and 44 for Q4. For vitality, cut-points were 58 for Q2, 51 for Q3, and 44 for Q4. The
p
value
is for trend analysis.
Table 4 – Cardiovascular fitness and muscle strength at baseline,
6 mo, and 12 mo
Baseline
6 mo
12 mo
p
value
Cardiovascular fitness (s)
ILRT 274.6 56.1 264.3 47.7 260.8 48.7 0.008 B
>
12
ART 269.6 50.9 254.8 41.7 256.8 47.7
<
0.001 B
>
12
DEL 278.8 52.5 276.3 53.8 268.3 47.1 0.063
Muscle strength (kg)
ILRT 161.2 57.6 188.9 63.5 199.4 65.5
<
0.001 B
<
6
<
12
ART 163.8 61.3 193.5 66.0 191.8 64.8 0.001 B
<
6, 12
DEL 168.8 73.7 177.1 70.0 187.5 76.8
<
0.001 B
<
12
ART = aerobic + resistance training; B = baseline; DEL = usual care/delayed
exercise; ILRT = impact-loading + resistance training.
Cardiovascular fitness determined by the 400-m walk; muscle strength
equals the sum for the chest press and leg press exercises.
E U R O P E A N U R O L O G Y 7 2 ( 2 0 1 7 ) 2 9 3 – 2 9 9
297