


 302 320

We further examined the subset of 16 patients who
remained free of metastases at 5 yr. Clinicopathologic
features for these patients are summarized in
Table 2. These
patients had more indolent tumor biology, as evidenced by
lower pT stage, lower grade tumors, and lower incidence of
adverse pathologic features such as coagulative tumor
necrosis and sarcomatoid differentiation.
Next, we examined the associations of clinicopathologic
features with the development of distant metastases, CSM,
and ACM to identify prognostic factors to aid patient risk
stratification and identify candidates for consideration of a
multimodal management approach. Univariable associa-
tions are summarized in
Table 3. Interestingly, neither the
number of LNs removed nor the number of positive LNs was
associated with oncologic outcomes. Similarly, the presence
of preoperative radiographic lymphadenopathy (cN1) was
not associated with oncologic outcomes (Supplementary
Fig. 4). On multivariable analysis
( Table 4 ), several features
were associated with the development of distant metasta-
ses: symptoms at presentation (HR 2.40,
p
= 0.03), IVC
tumor thrombus (HR 1.99;
p
= 0.003), clear cell (HR 2.21;
p
= 0.01) and collecting duct/not otherwise specified (NOS;
HR 4.28;
p
<
0.001) histologic subtypes, pT4 stage (HR 2.64;
p
= 0.005), and coagulative tumor necrosis (HR 2.51;
p
<
0.001). Three features were associated with both CSM
and ACM: ECOG PS 1, coagulative tumor necrosis, and
sarcomatoid differentiation, each associated with a 2.2–2.5-
fold higher risk of CSM and ACM. This probably reflects both
the risk of disease progression, as captured by adverse
pathologic features, and patient functional status, which
may reflect candidacy for systemic therapies. In stepwise
multivariable models with forced inclusion of the number
of LNs removed and number of positive LNs, neither feature
was significantly associated with oncologic outcomes
(Supplementary Table 2)
[1_TD$DIFF]
.
To facilitate clinical application of the above results, we
estimated MFS stratified according to the number of
adverse prognostic features present
( Fig.[7_TD$DIFF]
2 ). All patients
in the study had at least one of the five adverse features
(symptoms at presentation, IVC tumor thrombus, histologic
subtype of clear cell, collecting duct, or NOS, tumor stage
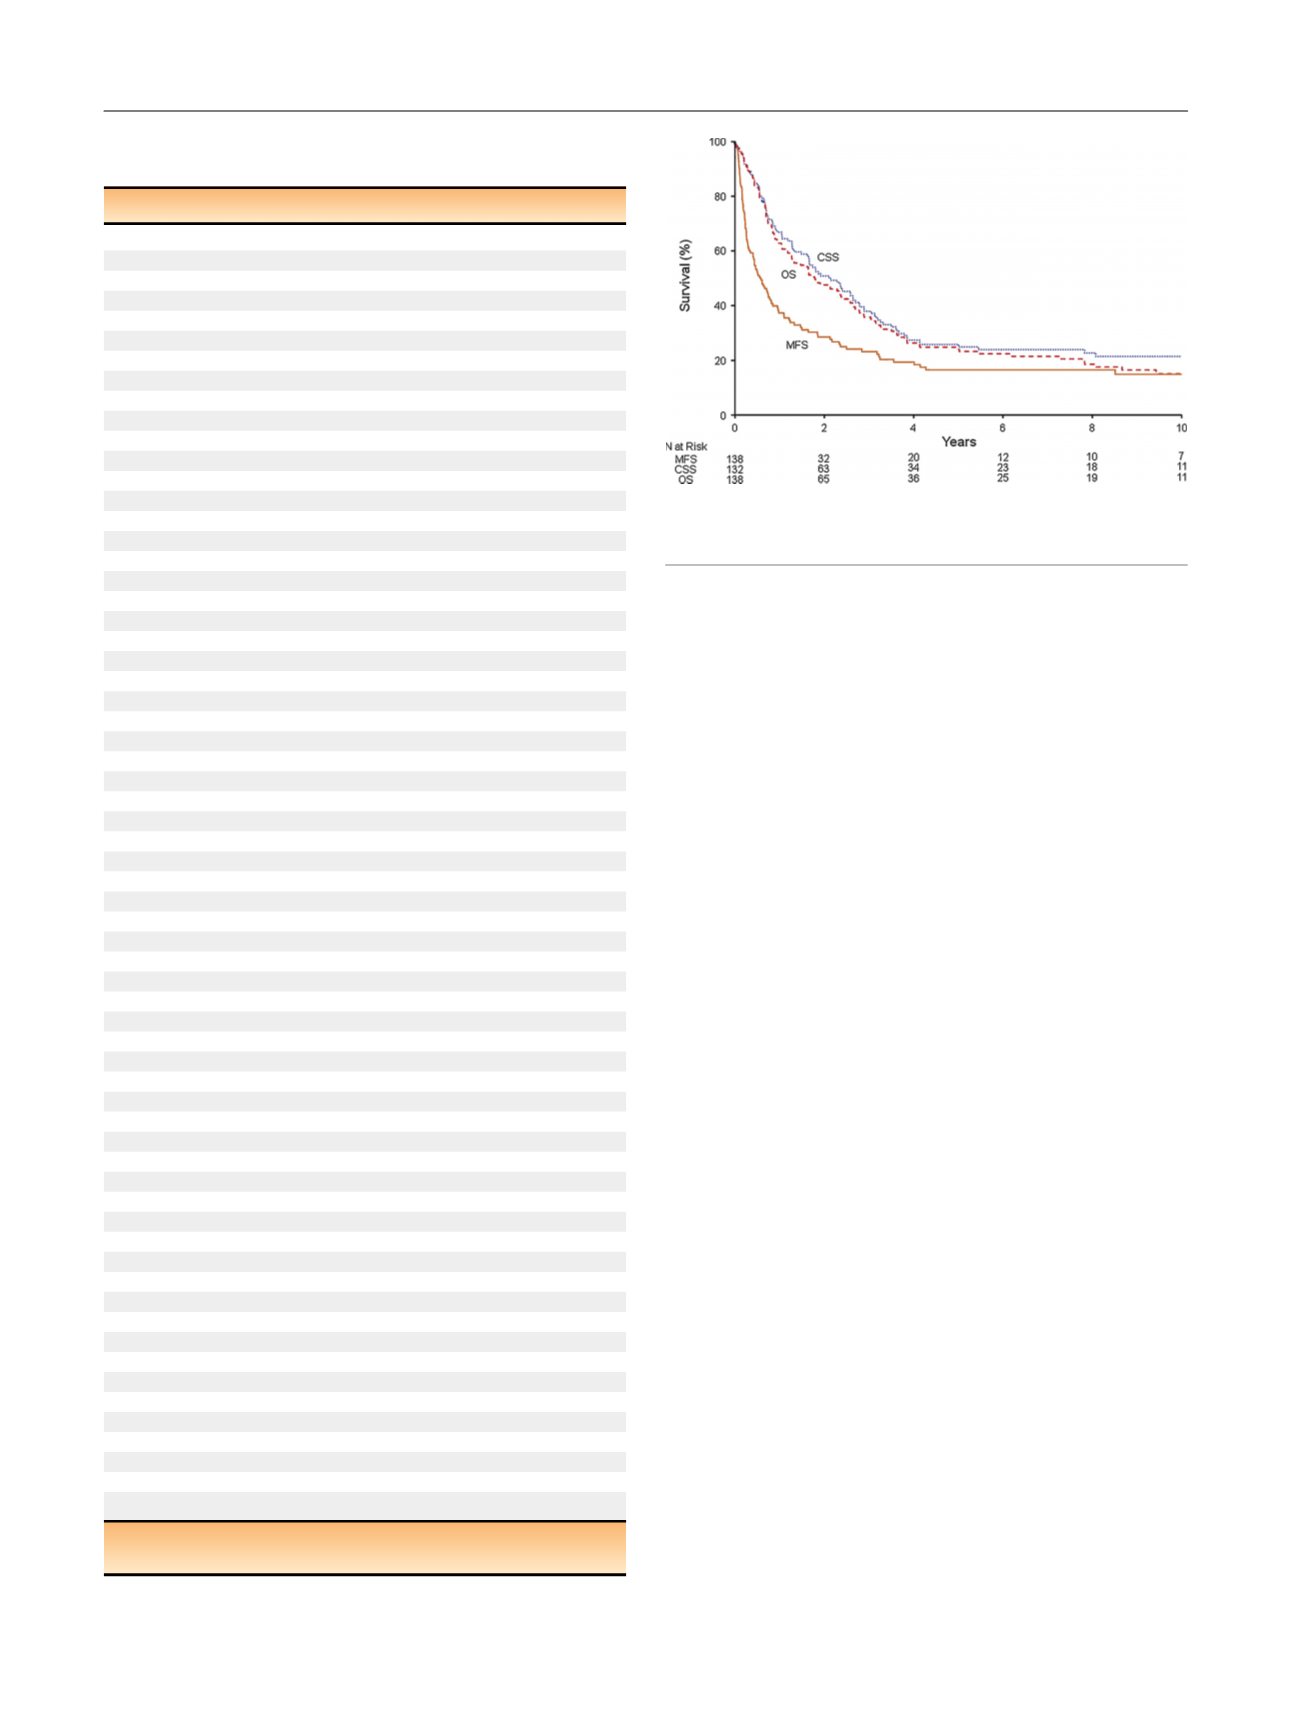
[(Fig._1)TD$FIG]
Fig. 1 – Distant metastases–free survival (MFS), cancer-specific survival
(CSS), and overall survival (OS).
Table 1 – Clinicopathologic and radiographic parameters for the
study cohort (
n
= 138)
Parameter
Result
Age at surgery (yr)
63 (54–72)
Charlson comorbidity index
0 (0–1)
Body mass index (kg/m
2
)
27.2 (24.0–31.1)
Tumor size (cm) (
n
= 137)
10.0 (8.0–13.0)
Number of lymph nodes removed (
n
= 124)
5 (2–14)
Number of positive lymph nodes (
n
= 124)
2 (1–3)
Year of surgery
1980–1991
34 (25)
1992–2004
60 (43)
2005–2010
44 (32)
Sex
Female
47 (34)
Male
91 (66)
Symptoms
125 (91)
Constitutional symptoms
69 (50)
Smoking history
Never
54 (39)
Current
36 (26)
Former
48 (35)
Eastern Cooperative Oncology Group performance status (
n
=
137
)
0
107 (78)
1
23 (17)
2
6 (4)
3
1 (1)
Body mass index
<
30 kg/m
2
91 (66)
30 kg/m
2
47 (34)
Radiographic evidence of:
Lymphadenopathy
60 (43)
Renal vein involvement
50 (36)
Inferior vena cava tumor thrombus
33 (24)
Preoperative systemic therapy
1 (1)
Type of surgery
Open radical nephrectomy
132 (96)
Laparoscopic radical nephrectomy
5 (4)
Open partial nephrectomy
1 (1)
Renal cell carcinoma histologic subtype
Clear cell
105 (76)
Papillary
15 (11)
Chromophobe
5 (4)
Collecting duct
4 (3)
Clear cell papillary
1 (1)
Not otherwise specified
8 (6)
2010 pT classification (
n
= 137)
pT1a
3 (2)
pT1b
10 (7)
pT2a
11 (8)
pT2b
7 (5)
pT3a
62 (45)
pT3b
31 (23)
pT3c
2 (1)
pT4
11 (8)
Grade
2
6 (4)
3
77 (56)
4
55 (40)
Coagulative tumor necrosis
111 (80)
Sarcomatoid differentiation
30 (22)
Number of lymph nodes
[3_TD$DIFF]
removed (
n
= 124)
<
13
88 (71)
13
36 (29)
Number of positive lymph nodes (
n
= 124)
1
57 (46)
2
67 (54)
Data are reported as median (interquartile range) for continuous variables
and as
n
(%) for categorical variables.
E U R O P E A N U R O L O G Y 7 2 ( 2 0 1 7 ) 3 0 0 – 3 0 6
302