


 303 320

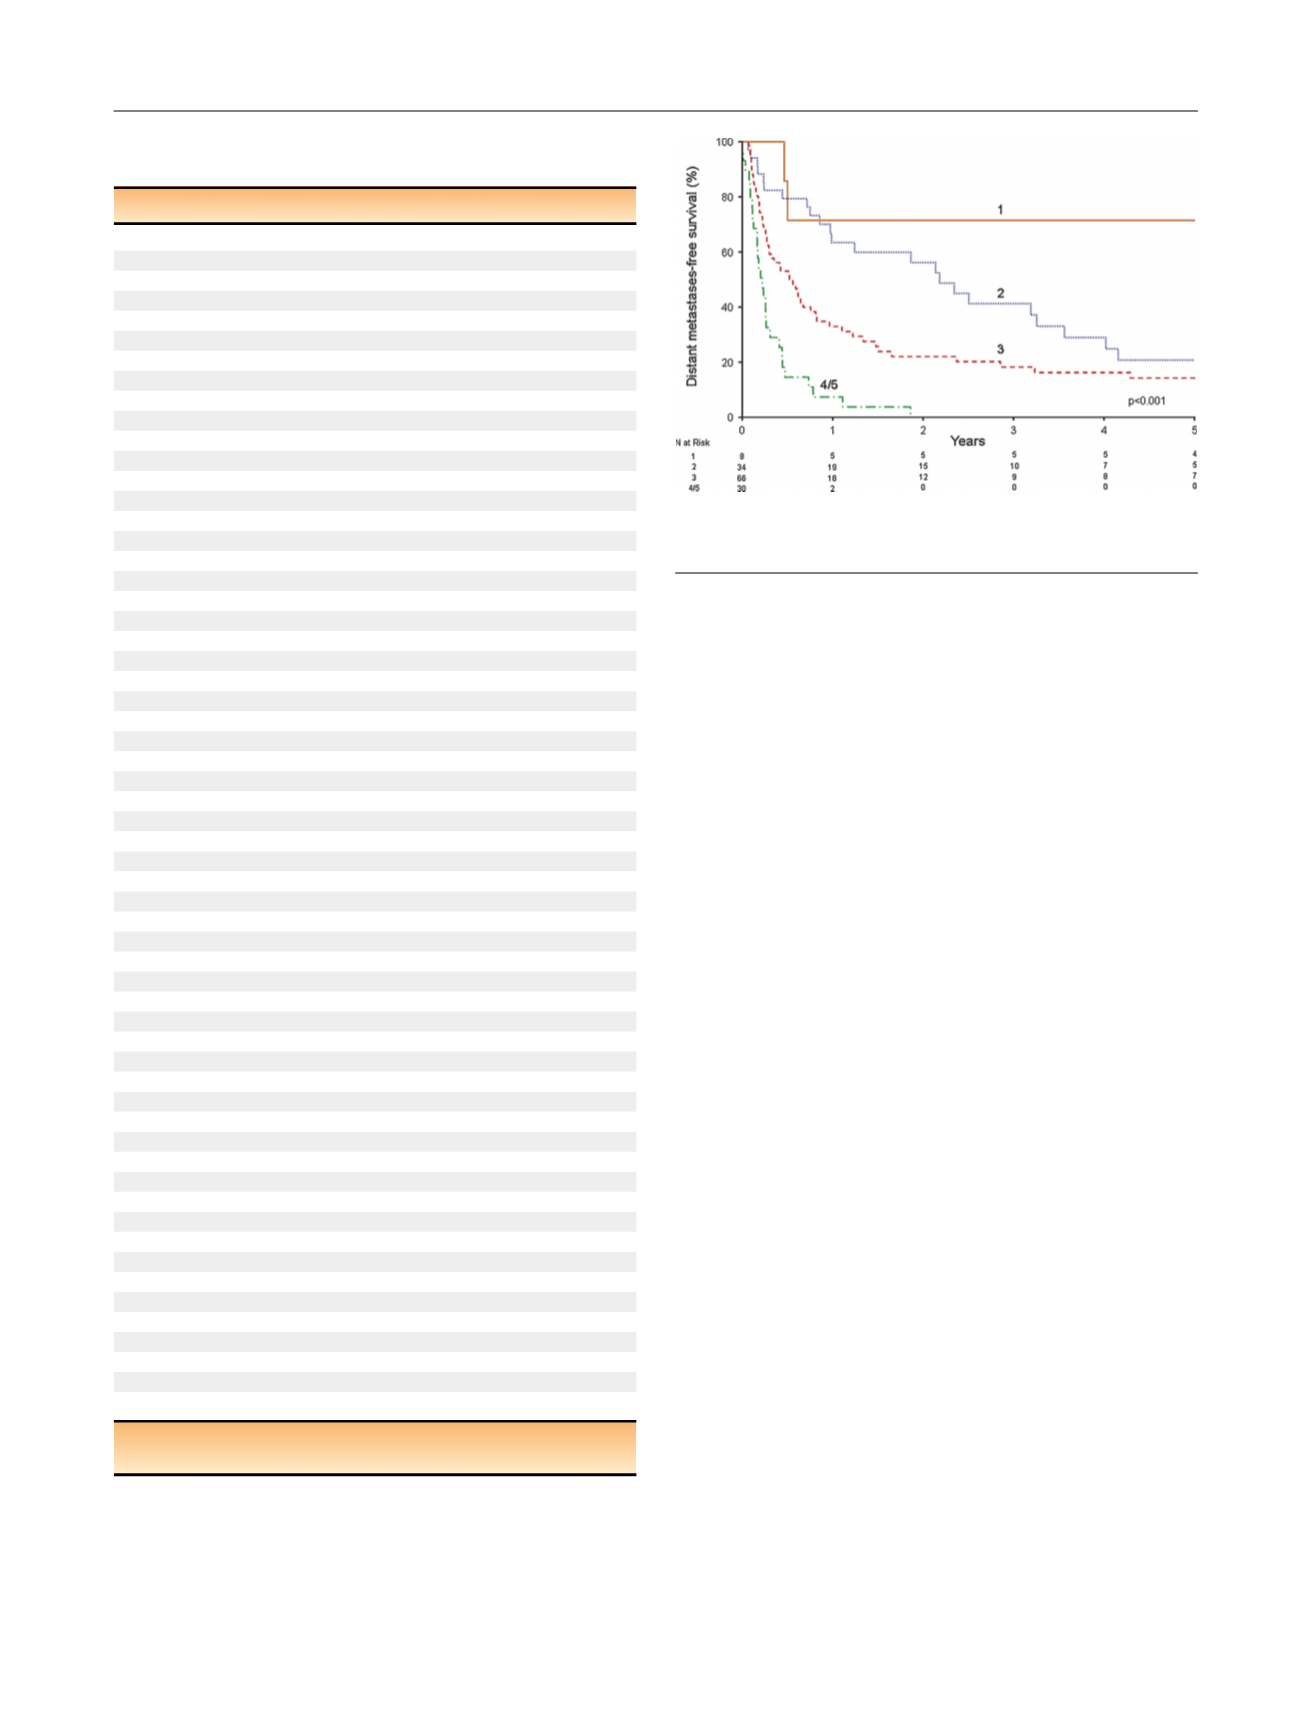
pT4, or coagulative tumor necrosis). There were eight (6%)
patients with one adverse feature, 34 (25%) with two, 66
(48%) with three, 27 (20%) with four, and three (2%) with all
five. MFS rates at 1 yr after surgery were 71%, 63%, 33%, and
7% for patients with one, two, three, and four or five adverse
features, respectively.
4.
Discussion
Isolated LN involvement in the absence of clinically evident
systemic metastases portends
[5_TD$DIFF]
a poor prognosis. In this
study, the probability of MFS at 5 yr after surgery was only
16%. More importantly, the median time to progression was
only 4.2 mo, and MFS at 1 yr was only 37%. In addition, CSM
and OS were very similar, suggesting that the majority of
patients with LN metastases die of disease without
substantial incidence of competing causes of mortality.
Taken together, these observations suggest the presence of
occult systemic disease in the majority of patients with
clinically isolated pN1 disease. However, the subset of
patients who do not harbor occult systemic disease at the
time of surgery experience durable long-term survival
following surgical resection of LN metastases: nearly all
patients who were free of progression at 5 yr remained free
of progression at long-term follow-up.
Improved risk-stratification is critical in guiding both
preoperative and postoperative management in these
patients. For instance, patients suspected of having occult
systemic disease may benefit from consideration of up-
front systemic therapy before nephrectomy, while in the
postoperative setting such patients may benefit from
consideration of adjuvant systemic therapy or enrollment
into a clinical trial. To this end, we identified several
features that were associated with systemic progression
following surgery that may be used to facilitate risk
stratification. It is clear from
Fig.[8_TD$DIFF]
2that patients with three
or more adverse features have poor prognosis with surgery
alone, and may benefit from consideration of a multimodal
management approach. Some of these prognostic factors
may be assessed preoperatively, as in the case of symptoms
at presentation, IVC tumor thrombus, and pT4 stage; others
require preoperative renal mass biopsy or surgical patholo-
gy, and may be limited to the postoperative setting. The
presence of such risk factors may identify patients who
Table 2 – Clinicopathologic features for patients free of distant
metastases at 5 yr after surgery (
n
= 16)
Parameter
Result
Age at surgery (yr)
57 (49–75)
Charlson comorbidity index
0 (0–1.5)
Body mass index (kg/m
2
[2_TD$DIFF]
)
26.4 (24.1–30.4)
Tumor size (cm) (
n
= 15)
10.0 (6.6–13.3)
Number of lymph nodes removed
6 (2.5–19)
Number of positive lymph nodes
1.5 (1–2.5)
Year of surgery
1980–1991
3 (19)
1992–2004
9 (56)
2005–2010
4 (25)
Sex
Female
5 (31)
Male
11 (69)
Symptoms
13 (81)
Constitutional symptoms
6 (38)
Smoking history
Never
9 (56)
Current
3 (19)
Former
4 (25)
Eastern Cooperative Oncology Group performance status
0
14 (88)
1
1 (6)
2
1 (6)
Body mass index
<
30 kg/m
2
10 (62)
30 kg/m
2
6 (38)
Radiographic evidence of:
Lymphadenopathy
4 (25)
Renal vein involvement
3 (19)
Inferior vena cava tumor thrombus
2 (13)
Preoperative systemic therapy
0
Type of surgery
Open radical nephrectomy
15 (94)
Laparoscopic radical nephrectomy
1 (6)
Renal cell carcinoma histologic subtype
Clear cell
13 (81)
Papillary
2 (13)
Clear cell papillary
1 (6)
2010 pT classification (
n
= 15)
pT1a
1 (7)
pT1b
2 (13)
pT2a
2 (13)
pT2b
0
pT3a
7 (47)
pT3b
2 (13)
pT3c
1 (7)
pT4
0
Grade
2
3 (19)
3
9 (56)
4
4 (25)
Coagulative tumor necrosis
7 (44)
Sarcomatoid differentiation
1 (6)
Number of lymph nodes
[3_TD$DIFF]
removed
<
13
11 (69)
13
5 (31)
Number of positive lymph nodes
1
8 (50)
2
8 (50)
Data are reported as median (interquartile range) for continuous variables
and as
n
(%) for categorical variables.
[(Fig._2)TD$FIG]
Fig. 2 – Distant metastases–free survival stratified according to the
number of adverse prognostic features.
E U R O P E A N U R O L O G Y 7 2 ( 2 0 1 7 ) 3 0 0 – 3 0 6
303