


 296 320

cipants, three men had missing data for fatigue and one
participant had missing data for vitality, resulting in
156 participants for fatigue and 158 for vitality in the
analyses. Men in the study were primarily, if not all,
Caucasian. During the trial, 34 men in ILRT, 31 in ART, and
29 in DEL received radiation therapy in conjunction with
ADT (
p
= 0.949). No men were on or progressed during the
trial to chemotherapy. In the 1st 6 mo of the study 37 men
withdrew with an additional 19 at 12 mo for a total of
56 men
( Fig. 1 ). Nutritional status did not differ among
groups over the 12-mon period (
p
= 0.245) nor was there a
significant interaction for physical activity among groups
(
p
= 0.063). There was no significant change in PSA
(
p
= 0.103) or testosterone (
p
= 0.083) during the study
period. Attendance at the supervised sessions was 65% and
69% for ILRT at 6 mo and 12 mo, respectively, 69% for ART for
the 1st 6-mo period, and 63% for DEL for the 6–12 mo
period.
3.2.
Fatigue and vitality
There was no difference among groups for fatigue
(
p
= 0.498) or vitality (
p
= 0.723) at baseline
( Table 3). With
training, there was no significant interaction (
p
= 0.304) but
a significant effect for time (
p
<
0.001) with fatigue reduced
(
p
= 0.005) in ILRT at 6 mo and 12 mo by 5 points, and in
ART (
p
= 0.005) and DEL (
p
= 0.022) by 5 points at 12 mo.
Similarly, there was no significant interaction (
p
= 0.525)
but a significant effect for time (
p
<
0.001) with vitality
increasing for all groups (
p
0.001) at 12 mo by 4 points.
There was no change in fatigue or vitality during the initial
6-mo usual care period for DEL. When levels of fatigue and
vitality were examined by quartiles, those with the highest
levels of fatigue and lowest levels of vitality at baseline
responded the best to exercise such that there was a
progressive decrease in fatigue (
p
trend
<
0.001) and increase
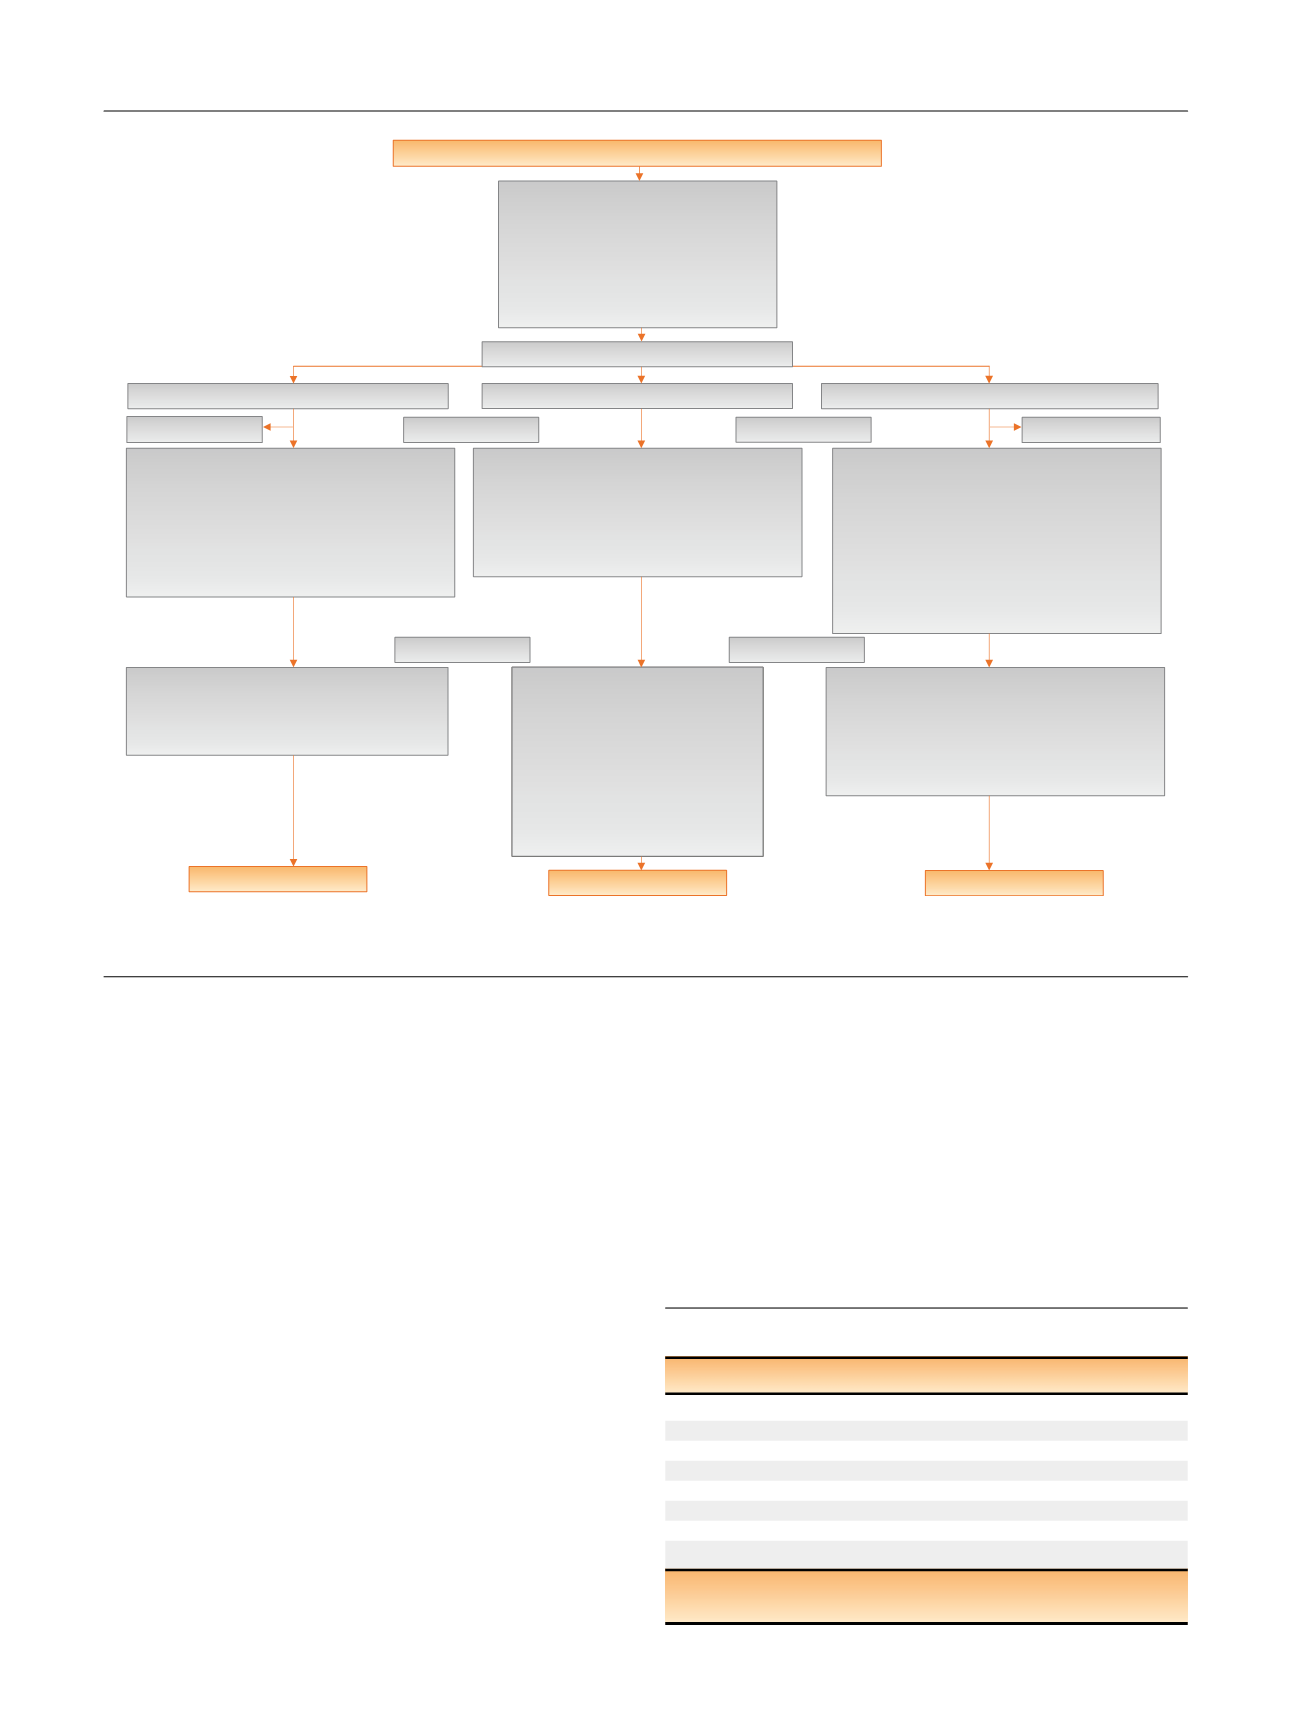
[(Fig._1)TD$FIG]
PotenƟal parƟcipants assessed for eligibility (
n
= 293)
Excluded (
n
= 130)
•
Declined to parƟcipate (
n
= 28)
•
Too far to travel (
n
= 19)
•
Unable to fit in with work (
n
= 7)
•
Unable to obtain GP consent (
n
= 13)
•
Ineligible (bone mets) (
n
= 9)
•
Other (
n
= 54)
Randomised (
n
= 163)
Allocated to resistance/cardiovascular (
n
= 54)
Allocated to usual care (
n
= 51)
DisconƟnued intervenƟon (
n
= 7)
•
Health (
n
= 1)
•
Injury (
n
= 1)
•
No longer interested in parƟcipaƟng (
n
= 1)
•
Ineligible (bone mets) (
n
= 2)
•
Other (
n
= 2)
DisconƟnued intervenƟon (
n
= 10)
•
Poor health (
n
= 1)
•
Injury (
n
= 1)
•
No longer interested in
parƟcipaƟng (
n
= 1)
•
Moved away (
n
= 1)
•
Unable to contact (
n
= 2)
•
Family Issues (
n
= 1)
•
Other (
n
= 3)
ITT analysed (
n
= 54)
DisconƟnued intervenƟon (
n
= 15)
•
Health (
n
= 3)
•
Injury (
n
= 3)
•
No longer interested in parƟcipaƟng (
n
= 4)
•
Moved away (
n
= 1)
•
Deceased (
n
= 2)
•
Other (
n
= 2)
DisconƟnued intervenƟon (
n
= 5)
•
Poor health (
n
= 2)
•
Moved away (
n
= 1)
•
Other (
n
= 2)
ITT analysed (
n
= 57)
6 mo
6 mo
12 mo
12 mo
ITT analysed (
n
= 48)
Lost to follow-up (
n
= 15)
•
Health (
n
= 1)
•
Injury (
n
= 2)
•
No longer interested in parƟcipaƟng (
n
= 4)
•
Moved away (
n
= 1)
•
Deceased (
n
= 1)
•
Unable to contact (
n
= 1)
•
Ineligible (bone mets) (
n
= 1)
•
Personal issues (
n
= 1)
•
Other (
n
= 3)
Lost to follow-up (
n
= 4)
•
Poor health (
n
= 1)
•
No longer interested in parƟcipaƟng (
n
= 2)
•
Work commitments (
n
= 1)
Missing data (
n
= 1)
Missing data (
n
= 3)
Allocated to resistance/impact loading (
n
= 58)
Fig. 1 – Consolidated standards of reporting trials diagram.
ITT = intention to treat; Mets = metastasis.
Table 3 – Fatigue and vitality at baseline, 6 mo, and 12 mo
Baseline
6 mo
12 mo
p
value
Fatigue
ILRT 27.9 20.7 22.2 15.4 22.5 16.6 0.005 B
>
6, 12
ART 23.4 18.1 21.9 18.4 17.7 15.0 0.005 B, 6
>
12
DEL 25.8 20.2 24.6 17.7 20.3 15.3 0.022 B, 6
>
12
Vitality
ILRT 50.0 10.8 51.9 8.0 54.6 8.5
<
0.001 B, 6
<
12
ART 51.5 10.7 52.7 9.8 55.3 8.7
0.001 B, 6
<
12
DEL 50.3 10.0 50.1 9.7 53.9 8.1
<
0.001 B, 6
<
12
ART = aerobic + resistance training; B = baseline; DEL = usual care/delayed
exercise; ILRT, impact-loading + resistance training.
E U R O P E A N U R O L O G Y 7 2 ( 2 0 1 7 ) 2 9 3 – 2 9 9
296