


 277 320

MRI-ultrasound fusion biopsy, and 22 were excluded for lack of research
consent
( Fig. 1 ).
2.2.
Imaging and interpretation
All patients underwent prostate imaging with identification of regions of
interest (ROIs) prior to MRI-ultrasound fusion biopsy
( Fig. 2). All scans at
UCSF were performed on 3-T MRI scanners (GE Healthcare, Waukesha,
WI, USA). Scans were acquired using the body coil for excitation and an
endorectal coil (E-Coil, Medrad, Pittsburgh, PA, USA) filled with
perfluorocarbon and a phased-array coil for reception
[11]. Images
were postprocessed to compensate for the reception profile of the
endorectal coil. Additional details regarding imaging methods are
provided in Supplement 1.
Subspecialized abdominal imaging radiologists interpreted all
mpMRIs on a picture archiving and communication system workstation
(Impax; Agfa, Mortsel, Belgium). Notable ROIs were given an MRI
suspicion score that models the validated Prostate Imaging Reporting
and Data System version 2 (Supplementary Table 1)
[12–14] .Each lesion
received a score of 1–5 corresponding to the lowest to highest suspicion
for PCa. Readers also assigned MRI T stages, tridimensional size in
millimeters, and location (right or left; apex, midgland, or base;
peripheral or transitional zone; anterior or posterior). Radiologists were
aware of patients’ histories of biopsy-proven PCa.
2.3.
Magnetic resonance imaging–ultrasound fusion biopsy
MRI-ultrasound fusion biopsies were performed by two urologists (K.S.
and H.G.N.), with one performing
>
95% of cases in this study, using the
UroNav Fusion Biopsy System (Invivo, Gainesville, FL, USA) and a TRUS
probe (Philips Healthcare, Amsterdam, the Netherlands) beginning in
2014. Recent T2-weighted MRI sequences of the prostate were fused
onto real-time ultrasound visualization. Targeted biopsies were taken
from ROIs identified on mpMRI. Next, systematic sampling was
performed in an extended-sextant template encompassing bilateral
anterior, apex, mid, base, medial, and lateral locations. All biopsy
specimens were graded according to the 2014 International Society of
Urological Pathology conventions and analyzed for maximum involve-
ment of PCa by genitourinary pathologists at UCSF
[15] .2.4.
Data analysis and statistical methods
We described age, prior GS, and clinical characteristics at the time of
MRI-ultrasound fusion biopsy with medians and interquartile ranges
(IQRs) for continuous variables and frequency tables for categorical
variables. Median values were compared between groups with the
Wilcoxon two-sample test. Numbers of core needle biopsy specimens
taken or positive for PCa, highest GS, and maximum tumor involvement
were reported for MRI-ultrasound fusion and systematic biopsies.
Agreement between GS at systematic versus MRI-ultrasound fusion
biopsies was evaluated with McNemar’s test of symmetry. Cancer
upgrading was defined as an increase in GS. Specifically, any upgrading
designated an increase to GS 3 + 4 (eg, GS 3 + 3 to 3 + 4, 4 + 3 to 4 + 4)
and major upgrading signified an increase to GS 4 + 3. Our primary
outcomes were any upgrading and major upgrading from systematic to
MRI-ultrasound fusion biopsy results at the same session. In addition, we
reported rates of upgrading from prior biopsy to concurrent systematic
and MRI-ultrasound fusion biopsies.
Multivariate logistic regression analysis examined factors associated
with likelihood of any or major upgrading from systematic to MRI-
ultrasound fusion biopsy results. As most patients with surveillance do
not undergo immediate treatment allowing for analysis of surgical
pathology, we aimed to determine which features might indicate a
probability of GS discordance between systematic and MRI-ultrasound
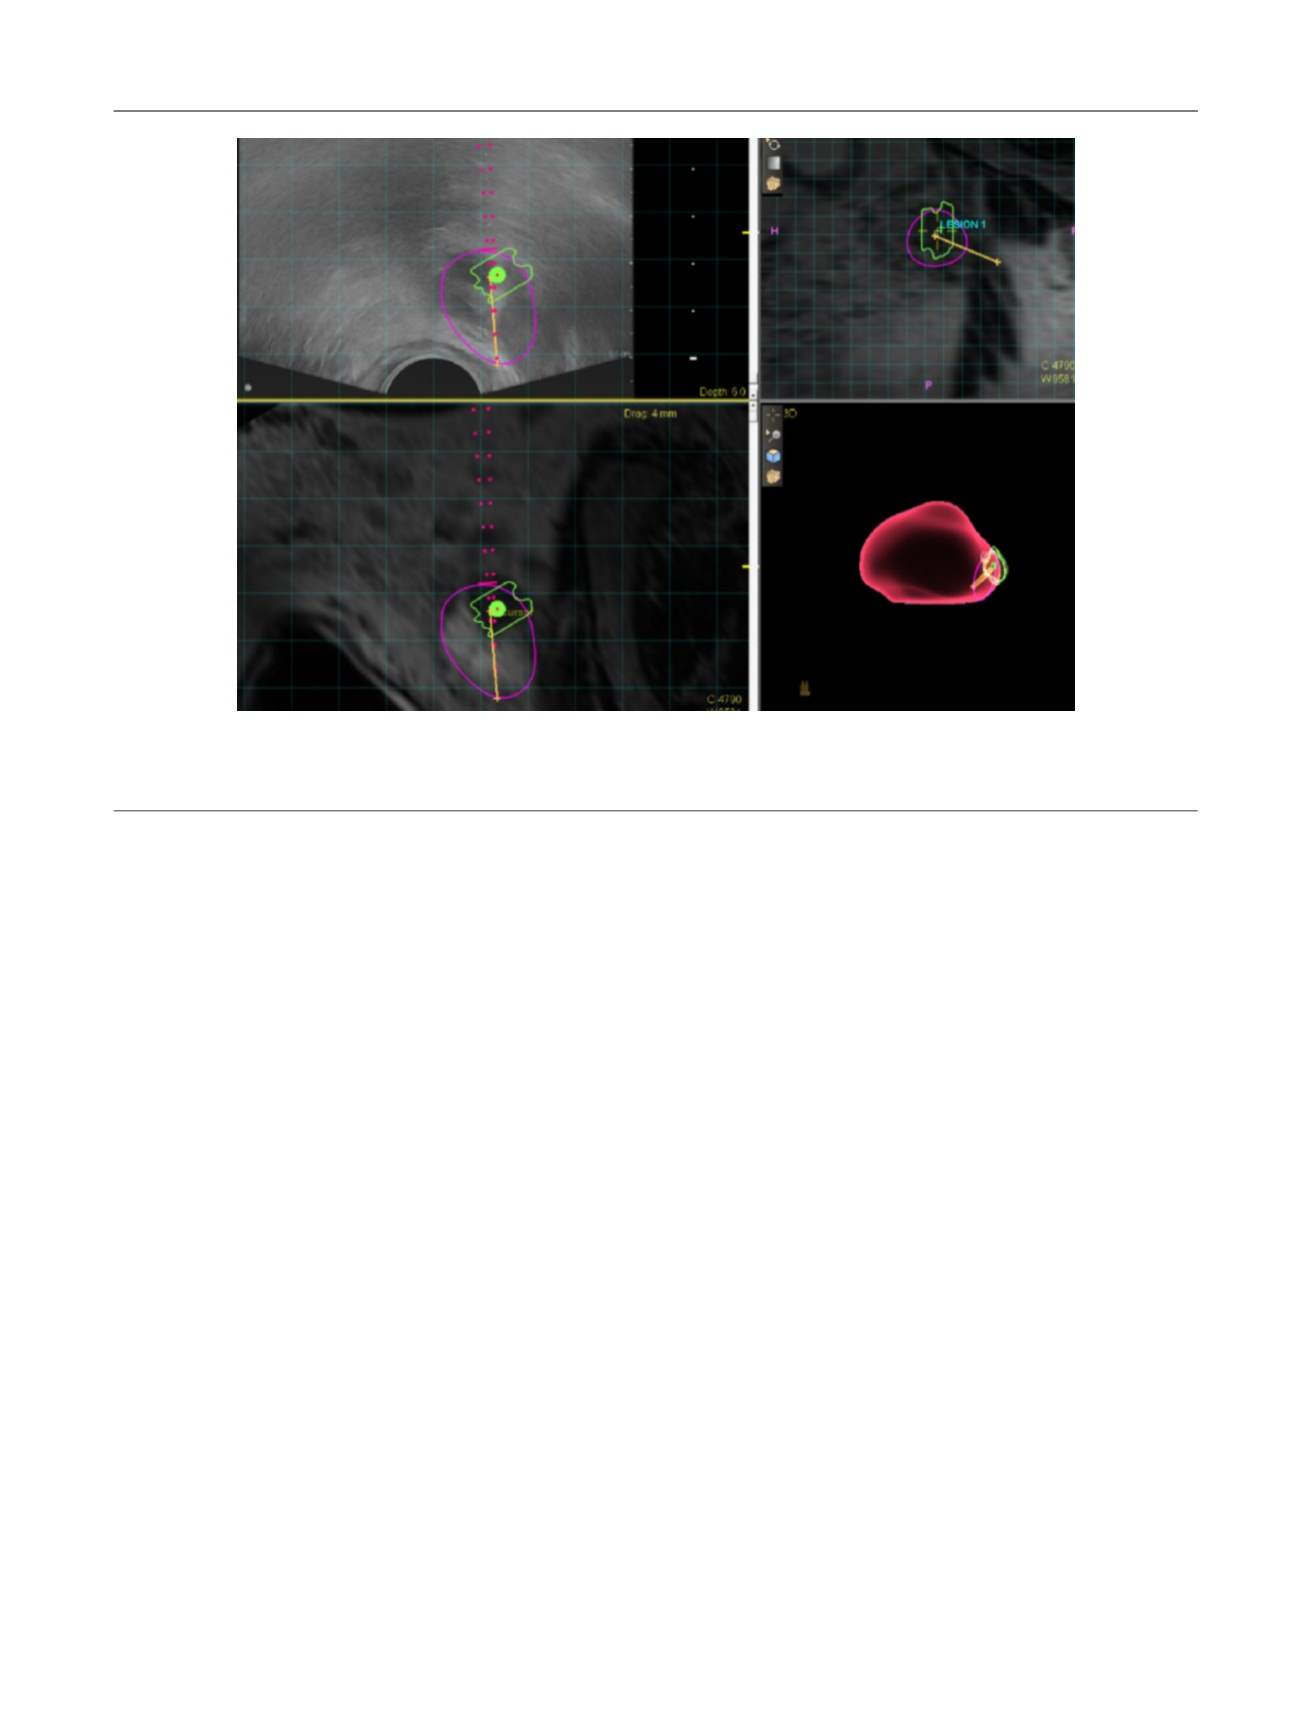
[(Fig._2)TD$FIG]
Fig. 2 – Representative screen capture of magnetic resonance imaging–ultrasound fusion biopsy in a 64-yr-old man with active surveillance for Gleason
score 3 + 3 disease. This specific lesion received a score of 5 on Prostate Imaging Reporting and Data System version 2 (highly likely to be clinically
significant cancer) with extracapsular extension, and targeted biopsy detected Gleason score 4 + 4 prostate cancer.
E U R O P E A N U R O L O G Y 7 2 ( 2 0 1 7 ) 2 7 5 – 2 8 1
277