


 185 320

0.44–1.00,
p
= 0.81); for reference standard (radical prosta-
tectomy vs biopsy), sensitivity of 0.89 (95% CI 0.83–0.95)
versus 0.91 (95% CI 0.88–0.94,
p
<
0.01) and specificity of
0.65 (95% CI 0.37–0.94) versus 0.73 (95% CI 0.58–0.87,
p
= 0.48). Other variables, including the cutoff value, use of
endorectal coil, and type of analysis (per patient vs per
lesion), were not significant factors (
p
= 0.32–0.70).
3.6.
Subgroup analysis
As there were four studies that used both 3 and 4
as cutoff values
[17,22,23,29], or determined both any
cancer and clinically significant cancer as outcomes
[16,21,24,29,32], multiple subgroup analyses were per-
formed in order to assess various clinical settings (Supple-
mentary
Table 2). Regarding cutoff values, the pooled
sensitivity was 0.89 (95% CI 0.84–0.92) with specificity of
0.74 (95% CI 0.58–0.85) for 17 studies using 4
[16–31,35],
whereas these were 0.95 (95% CI 0.89–0.97) and 0.47 (95%
CI 0.21–0.74) in eight studies using 3
[17,22,23,29,32– 34,36]. When we stratified studies according to the
outcome assessed, the following results were yielded: (1)
cutoff of 4 for determining any PCa, sensitivity of 0.89
(95% CI 0.83–0.93) with specificity of 0.80 (95% CI 0.62–
0.90); (2) cutoff of 3 for determining any PCa, sensitivity of
0.96 (95% CI 0.93–0.98) with specificity of 0.49 (0.29–0.70);
(3) for determining csPCa regardless of cutoff values,
sensitivity of 0.89 (95% CI 0.84–0.92) with specificity of
0.64 (95% CI 0.46–0.78); (4) cutoff of 4 for determining
csPCa, sensitivity of 0.90 (95% CI 0.85–0.94) with specificity
of 0.62 (95% CI 0.45–0.77); and (5) cutoff of 3 for
determining csPCa, sensitivity of 0.96 (95% CI 0.87–0.99)
with specificity of 0.29 (0.05–0.77). When the studies using
a cutoff value of 4 were separately assessed according to
the type of analysis, per-patient analysis in eight studies
[17,18,20,26,27,29,31,35]yielded pooled sensitivity of 0.89
(95% CI 0.81–0.93) with specificity of 0.76 (95% CI 0.60–
0.88), whereas per-lesion analysis in nine studies
[16,19,21–25,28,30]yielded pooled sensitivity of 0.87
(95% CI 0.83–0.91) with specificity of 0.70 (95% CI 0.44–
0.88).
Based on the localization of PCa, the pooled sensitivity
was 0.93 (95% CI 0.87–0.96) with specificity of 0.68 (95% CI
0.43–0.86) in seven studies analyzing PZ cancers
[20,24,25,28,30,31,33]. In identical studies, except for that
by Stanzione et al
[31], which analyzed TZ cancers, the
pooled sensitivity and specificity were 0.88 (95% CI 0.77–
0.94) and 0.75 (95% CI 0.59–0.86), respectively.
Studies including patients without previous biopsies
yielded sensitivity of 0.82 (95% CI 0.72–0.90) and specificity
of 0.75 (95% CI 0.65–0.83), whereas the diagnostic perfor-
mance values were 0.87 (95% CI 0.80–0.92) and 0.71 (95% CI
0.42–0.89) in studies including patients with a history of
previous biopsy.
3.7.
Discussion
In our meta-analysis, we assessed the diagnostic accuracy of
PI-RADSv2 for detecting PCa. The pooled sensitivity and
specificity of all 21 studies were 0.89 (95% CI 0.86–0.92) and
0.73 (95% CI 0.60–0.83), respectively. When comparing our
data with the only two existing meta-analyses using mpMRI
for detecting PCa, a trend toward higher sensitivity and
lower specificity can be inferred. In the study by de Rooij
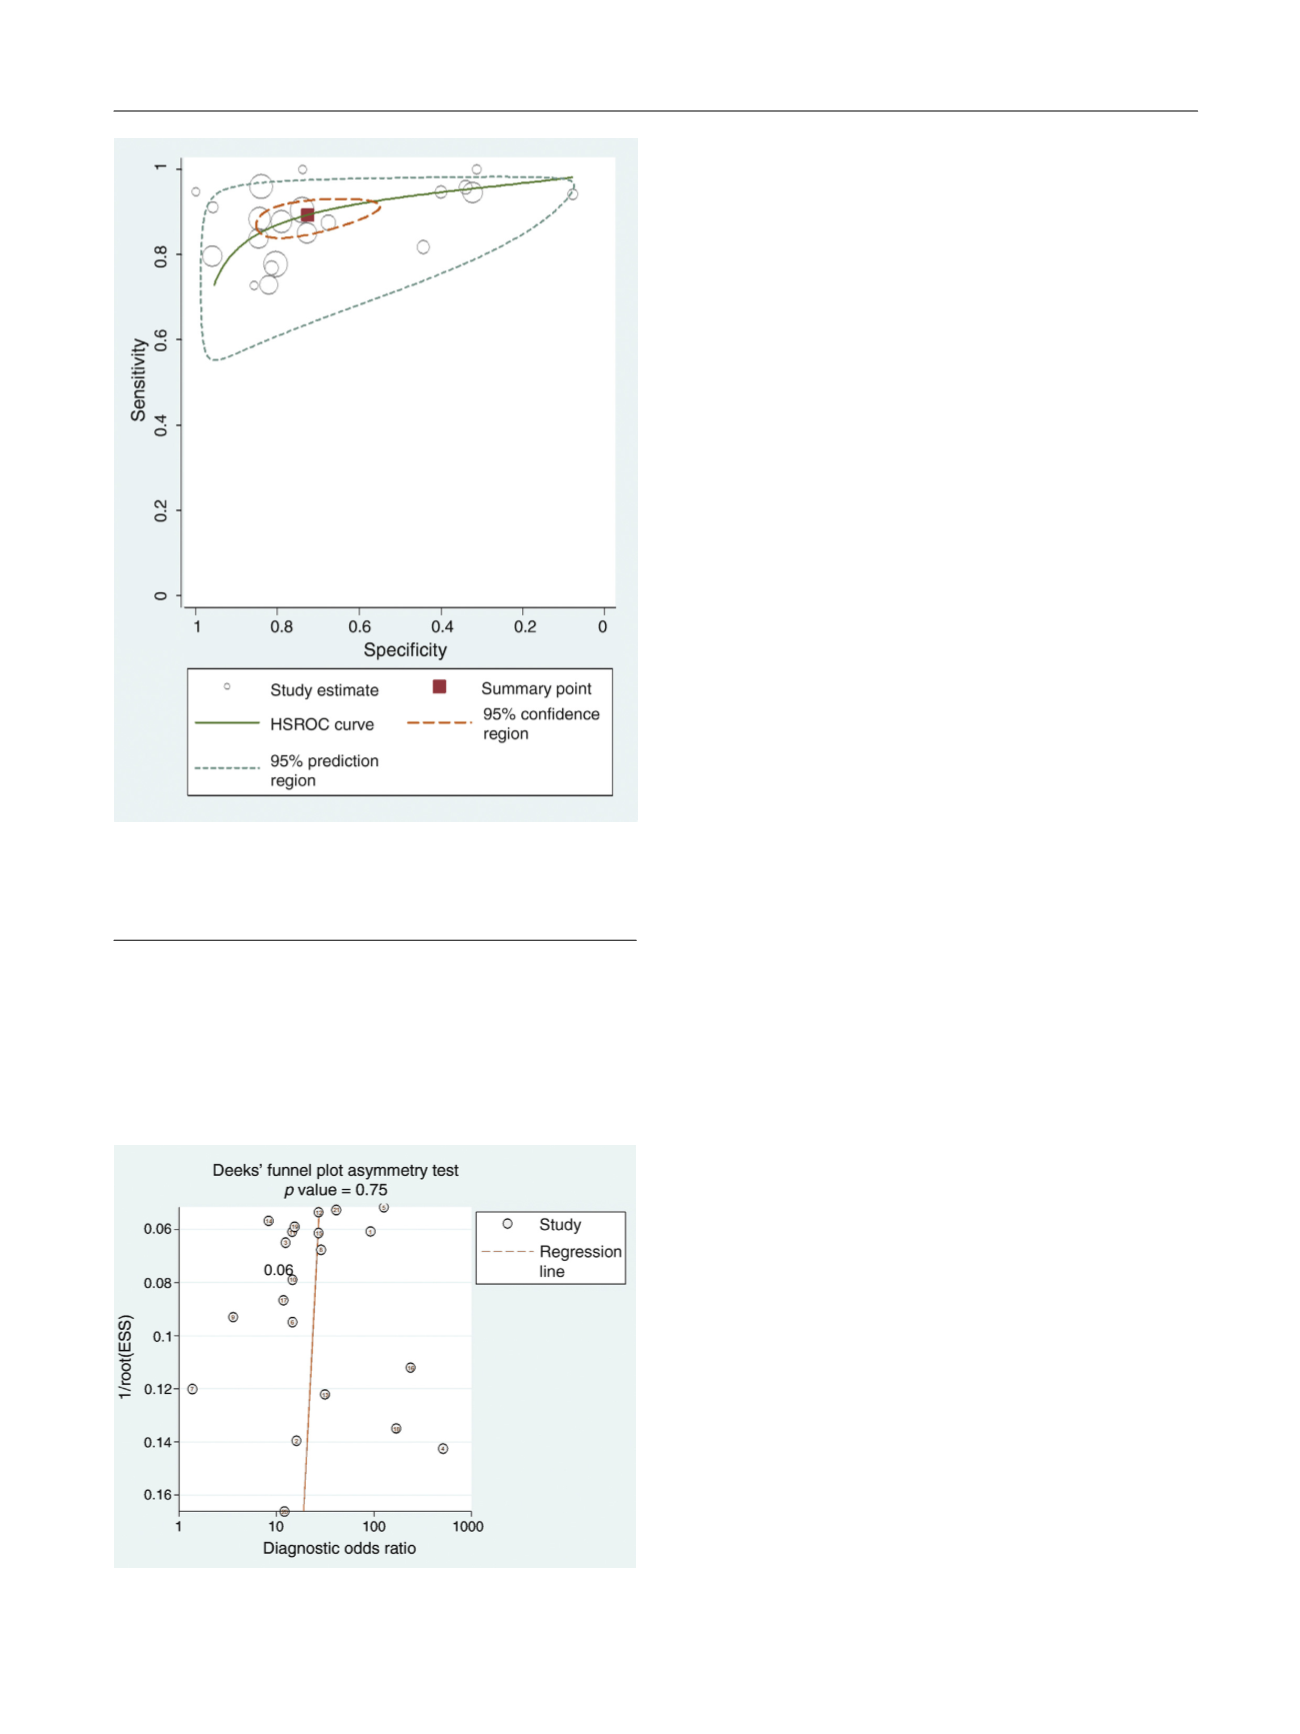
[(Fig._4)TD$FIG]
Fig. 4 – Hierarchical summary receiver operating characteristic curve of
the diagnostic performance of PI-RADSv2 for detecting prostate cancer.
HSROC = hierarchical summary receiver operating characteristic; PI-
RADSv2 = Prostate Imaging Reporting and Data System version 2.
[(Fig._5)TD$FIG]
Fig. 5 – Deeks’ funnel plot. A
p
value of 0.75 suggests that the likelihood
of publication bias is low.
E U R O P E A N U R O L O G Y 7 2 ( 2 0 1 7 ) 1 7 7 – 1 8 8
185