


 184 320

proportion of patients with PCa showed a statistically
significant and clinically meaningful difference: 0.65 (95%
CI 0.52–0.78) in studies 50% of patients with PCa versus
0.86 (0.75–0.97) in studies with
>
50% of patients with PCa.
Otherwise, no clinically meaningful differences were seen:
for magnet strength (3 vs 1.5 T), sensitivity of 0.90 (95% CI
0.86–0.94) versus 0.89 (95% CI 0.81–0.97,
p
= 0.03) and
specificity of 0.73 (95% CI 0.59–0.86) versus 0.72 (95% CI
[(Fig._2)TD$FIG]
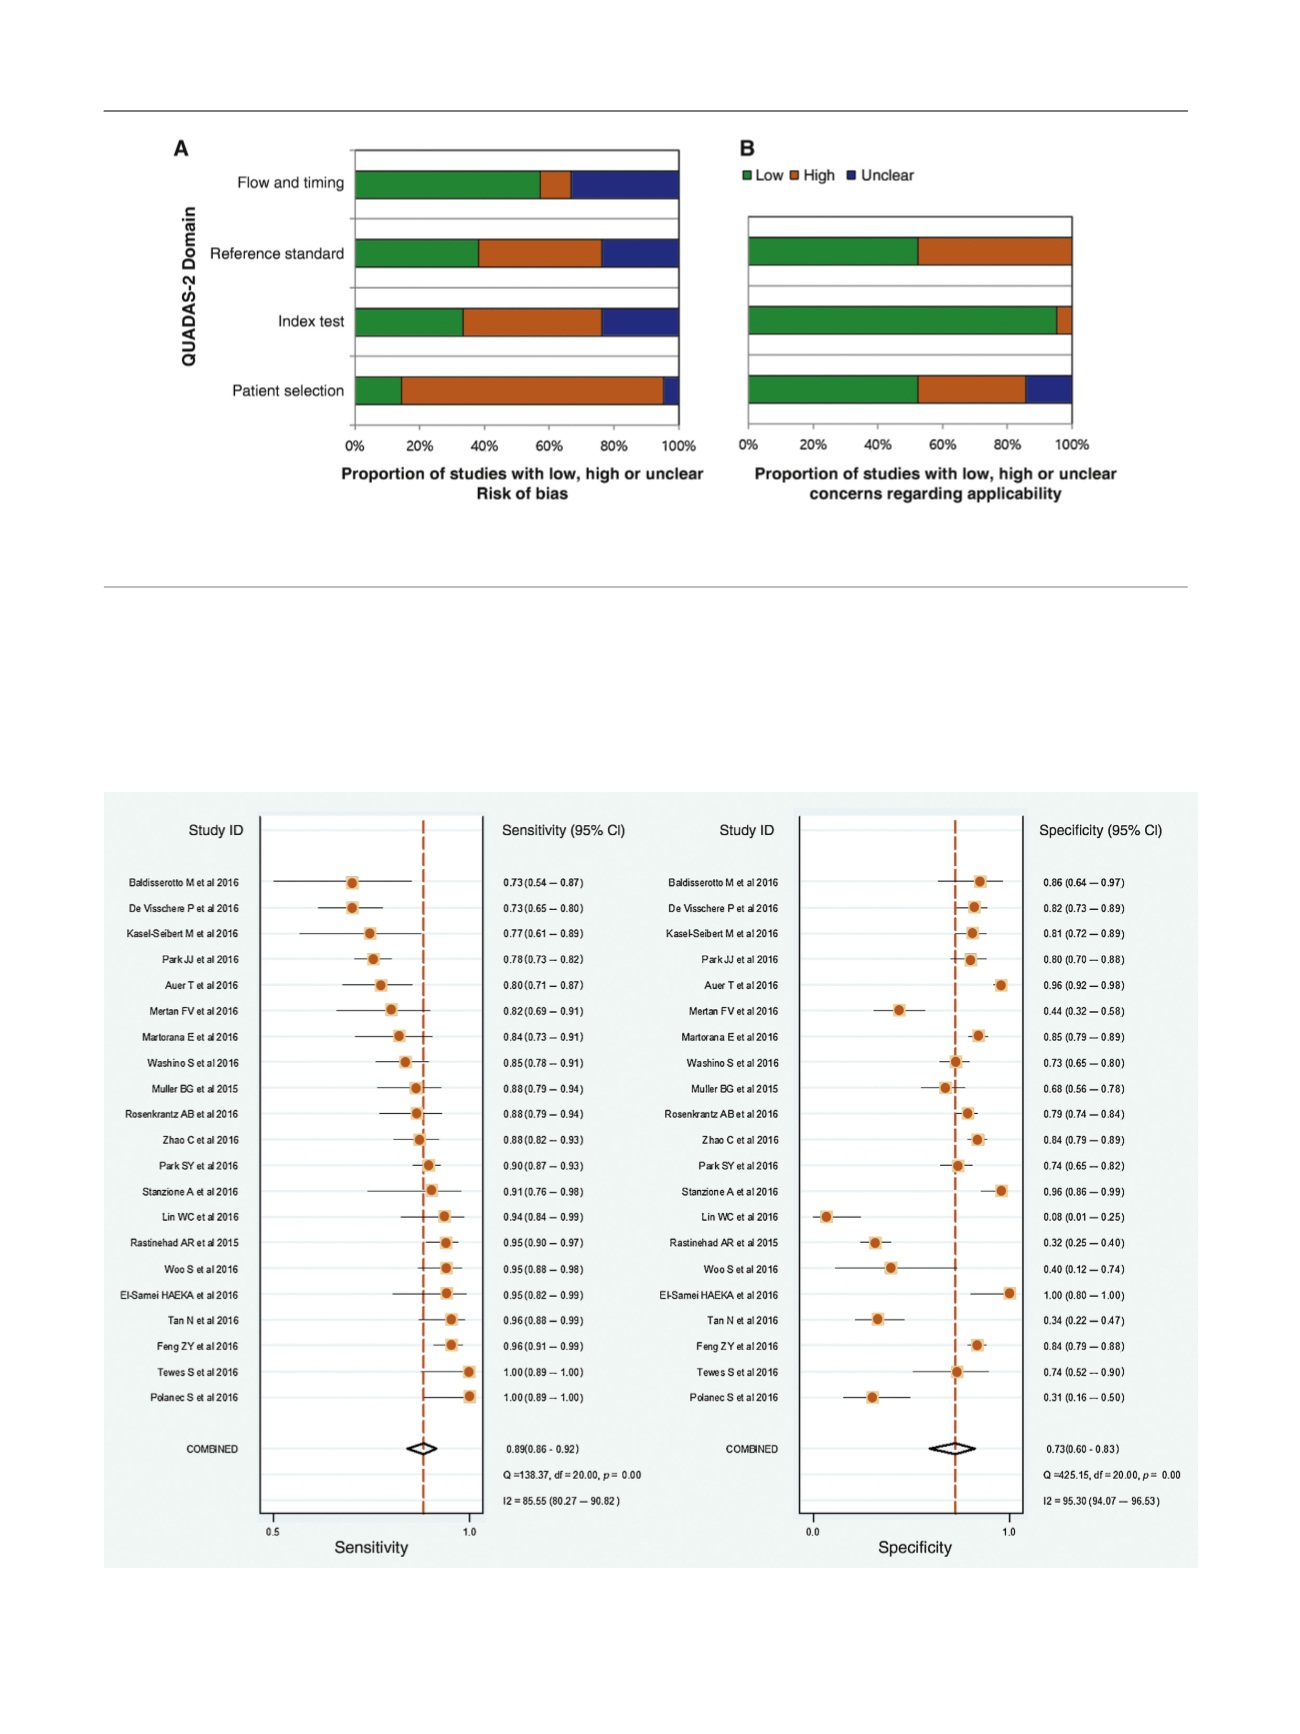
Fig. 2 – Grouped bar charts show (A) risk of bias and (B) concerns for applicability of 21 included studies using QUADAS-2. QUADAS-2 = Quality
Assessment of Diagnostic Accuracy Studies-2.
Fig. 3 – Coupled forest plots of pooled sensitivity and specificity. Numbers are pooled estimates with 95% CI in parentheses. Corresponding
heterogeneity statistics are provided at bottom right corners. Horizontal lines indicate 95% CIs. CI = confidence intervals.
E U R O P E A N U R O L O G Y 7 2 ( 2 0 1 7 ) 1 7 7 – 1 8 8
184