


 284 320

The biopsy Gleason score (GS), number of total and positive
cores, total and maximum cancer core length (CCL), and maximum
cancer core invasion (CCI) rate were recorded according to the
Standards of Reporting for MRI-targeted Biopsy Studies (START)
criteria
[16].
Clinically significant PCa was defined according to previously
published studies: the START criteria for TB (biopsy GS 7 or
maximum CCL 5 mm)
[16,17]and the updated Epstein criteria for
SB
[18] .2.6.
Sample size determination and statistical analyses
A sample size of 186 patients (93 per arm) was required to detect a 20%
absolute increase (from 30% to 50% with arm B vs arm A, respectively) in
the DR of PCa, with an
a
error of 0.05 and a
b
error of 0.20 (two-sample
test for proportions, superiority design). Considering 10% of patients lost
to follow-up, the total sample size needed was 205 patients. No interim
analyses were planned, and all procedures were performed on an
intention-to-treat basis.
The associations between categorical variables (PI-RADS score and
GS) and the arm were analyzed by Fisher’s exact test; Mann-Whitney
and Kruskal-Wallis tests were used for continuous variables. All of the
results for continuous variables are expressed as the median
(interquartile range [IQR]). All of the reported
p
values were obtained
by the two-sided exact method at the conventional 5% significance
level. Data were analyzed as of April 2016 by R software v.3.2.3
(R Foundation for Statistical Computing, Vienna, Austria), according
to previously published guidelines for the reporting of statistics
[19] .3.
Results
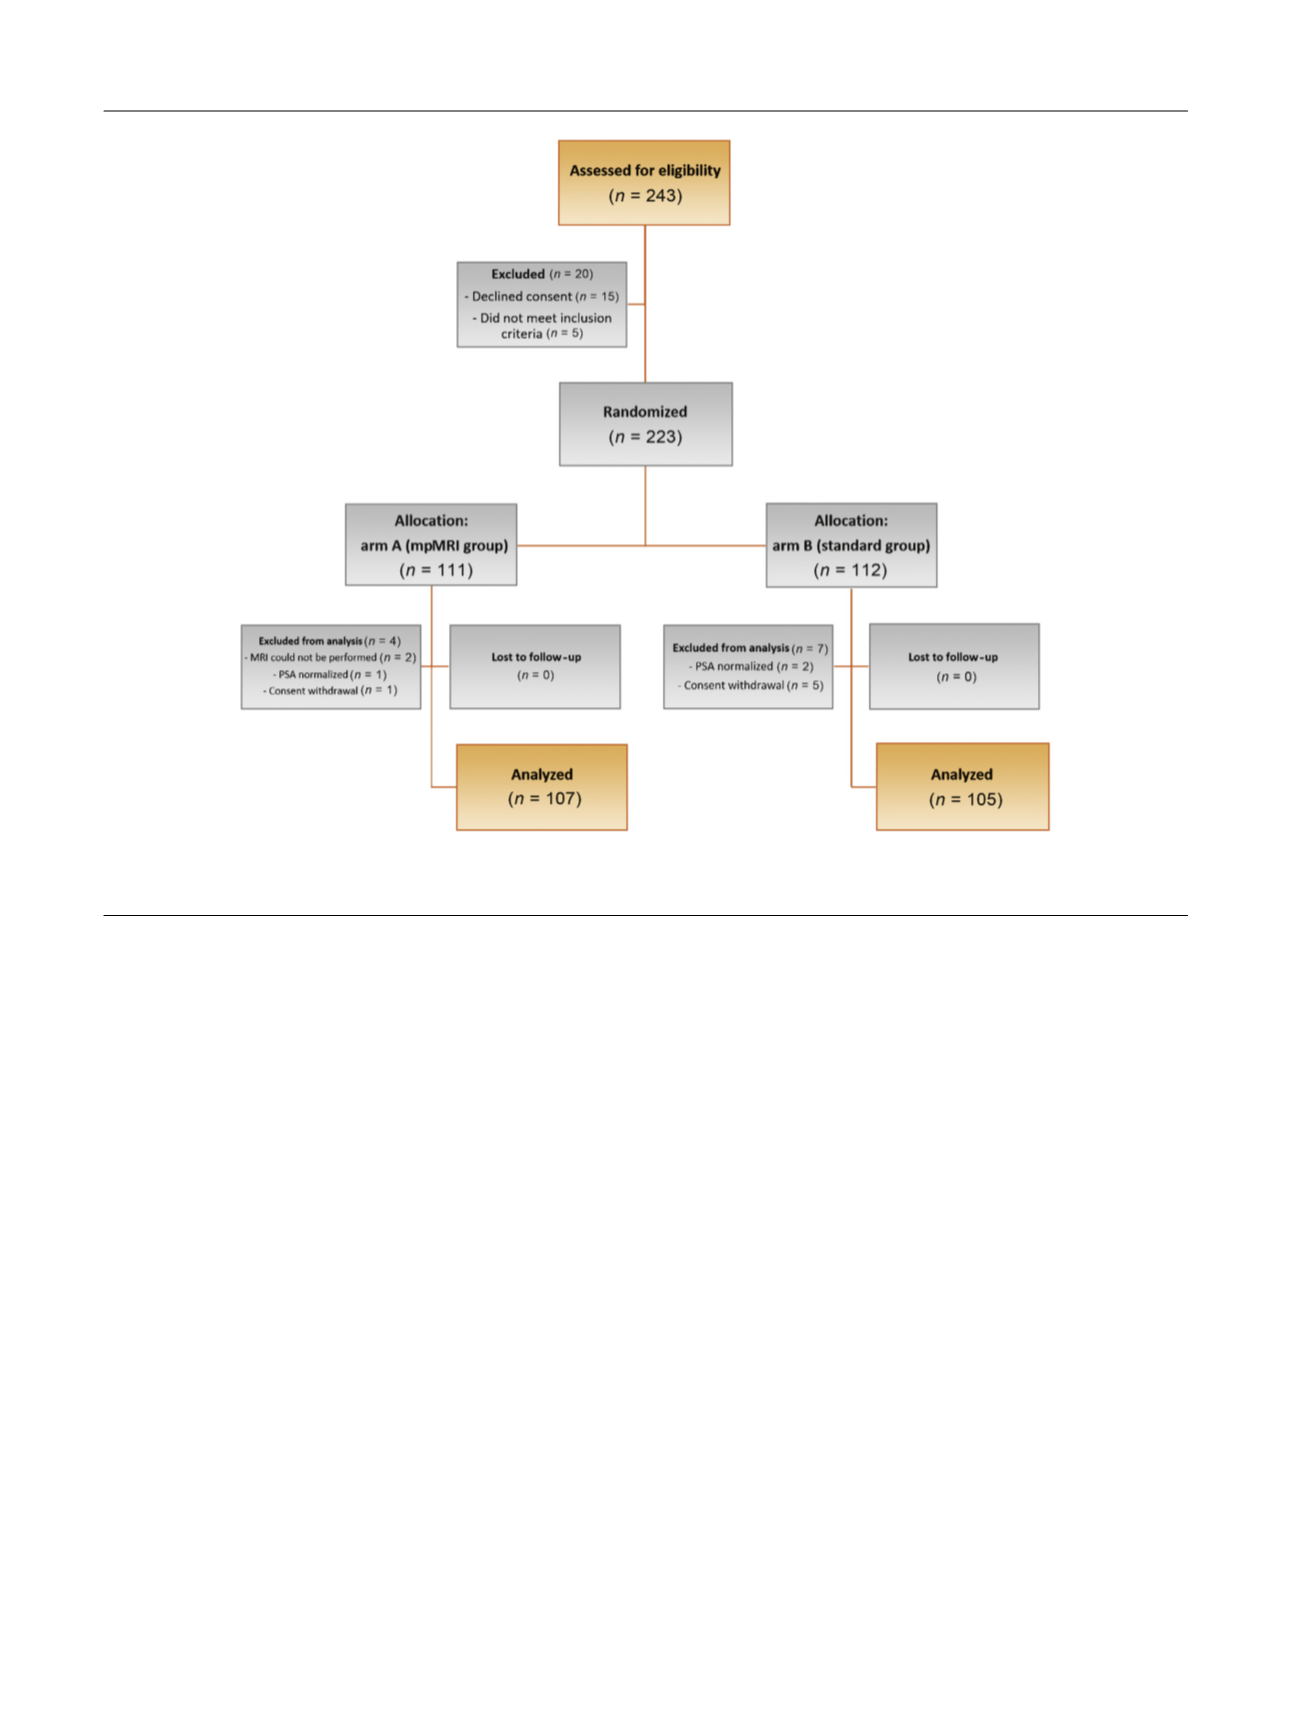
Totals of 111 and 112 patients were enrolled in arms A and B,
respectively. Protocol violations were registered in 4 of
111 patients (3.6%) and 7 of 112 patients (6.3%) in arms A and
B, respectively. After exclusion of these patients, 107 and
105 patients per arm were evaluable in arms A and B,
respectively. The patients’ demographics are reported in
Table 1.
3.1.
Comparison between arm A and arm B
As reported in
Table 2, there was a significant difference
between arms A and B in the overall DRs of PCa (50.5% vs
29.5%, respectively;
p
= 0.002) and csPCa (43.9% vs 18.1%,
respectively;
p
<
0.001).
3.2.
Comparison between targeted and standard biopsy
In arm A, mpMRI was positive in 81 patients (75.7%) who
underwent TB and negative in 26 patients (24.3%) who
underwent SB. A significant difference was recorded when
stratifying the patients on the basis of the biopsy approach,
that is, TB, SB in arm A, and SB in arm B, in terms of the
overall DRs of PCa (60.5% vs 19.2% vs 29.5%, respectively;
p
<
0.001) and csPCa (56.8% vs 3.8% vs 18.1%, respectively;
p
<
0.001)
( Table 2).
[(Fig._1)TD$FIG]
Fig. 1 – Consolidated Standards of Reporting Trials flow diagram of the study.
mpMRI = multiparametric magnetic resonance imaging; MRI = magnetic resonance imaging; PSA = prostate-specific antigen.
E U R O P E A N U R O L O G Y 7 2 ( 2 0 1 7 ) 2 8 2 – 2 8 8
284